The ScyllaDB team is pleased to announce the release of ScyllaDB Monitoring Stack 3.8.
ScyllaDB Monitoring Stack is an open-source stack for monitoring ScyllaDB Enterprise and ScyllaDB Open Source, based on Prometheus and Grafana. ScyllaDB Monitoring Stack 3.8 supports:
- ScyllaDB Open Source versions 4.3, 4.4 and 4.5
- ScyllaDB Enterprise versions 2020.x and 2021.x
- ScyllaDB Manager 2.3.x, 2.4.x
This release brings new panels and graphs, new Advisor advice, as well as bug fixes and stability improvements.
Related Links
- Download ScyllaDB Monitoring 3.8
- ScyllaDB Monitoring Stack Docs
- Upgrade from ScyllaDB Monitoring 3.x to 3.y
Versions Updates in ScyllaDB Monitoring Stack 3.8
- Set Prometheus version to 2.27.1 #1398
- Set Grafana version to 7.5.7 #1406
- Update Loki to 2.2.1 #1362
- Update the Alertmanager version to 0.22.1 #1406
New in ScyllaDB Advisor
- New Advisor feature: Warn about prepared-statements’ cache eviction. (Learn more about ScyllaDB Advisor here.) Prepared statements are stored in their own cache, if they are being constantly evicted, it suggests that there is a problem with how the statements are prepared.
New information in in ScyllaDB Dashboards
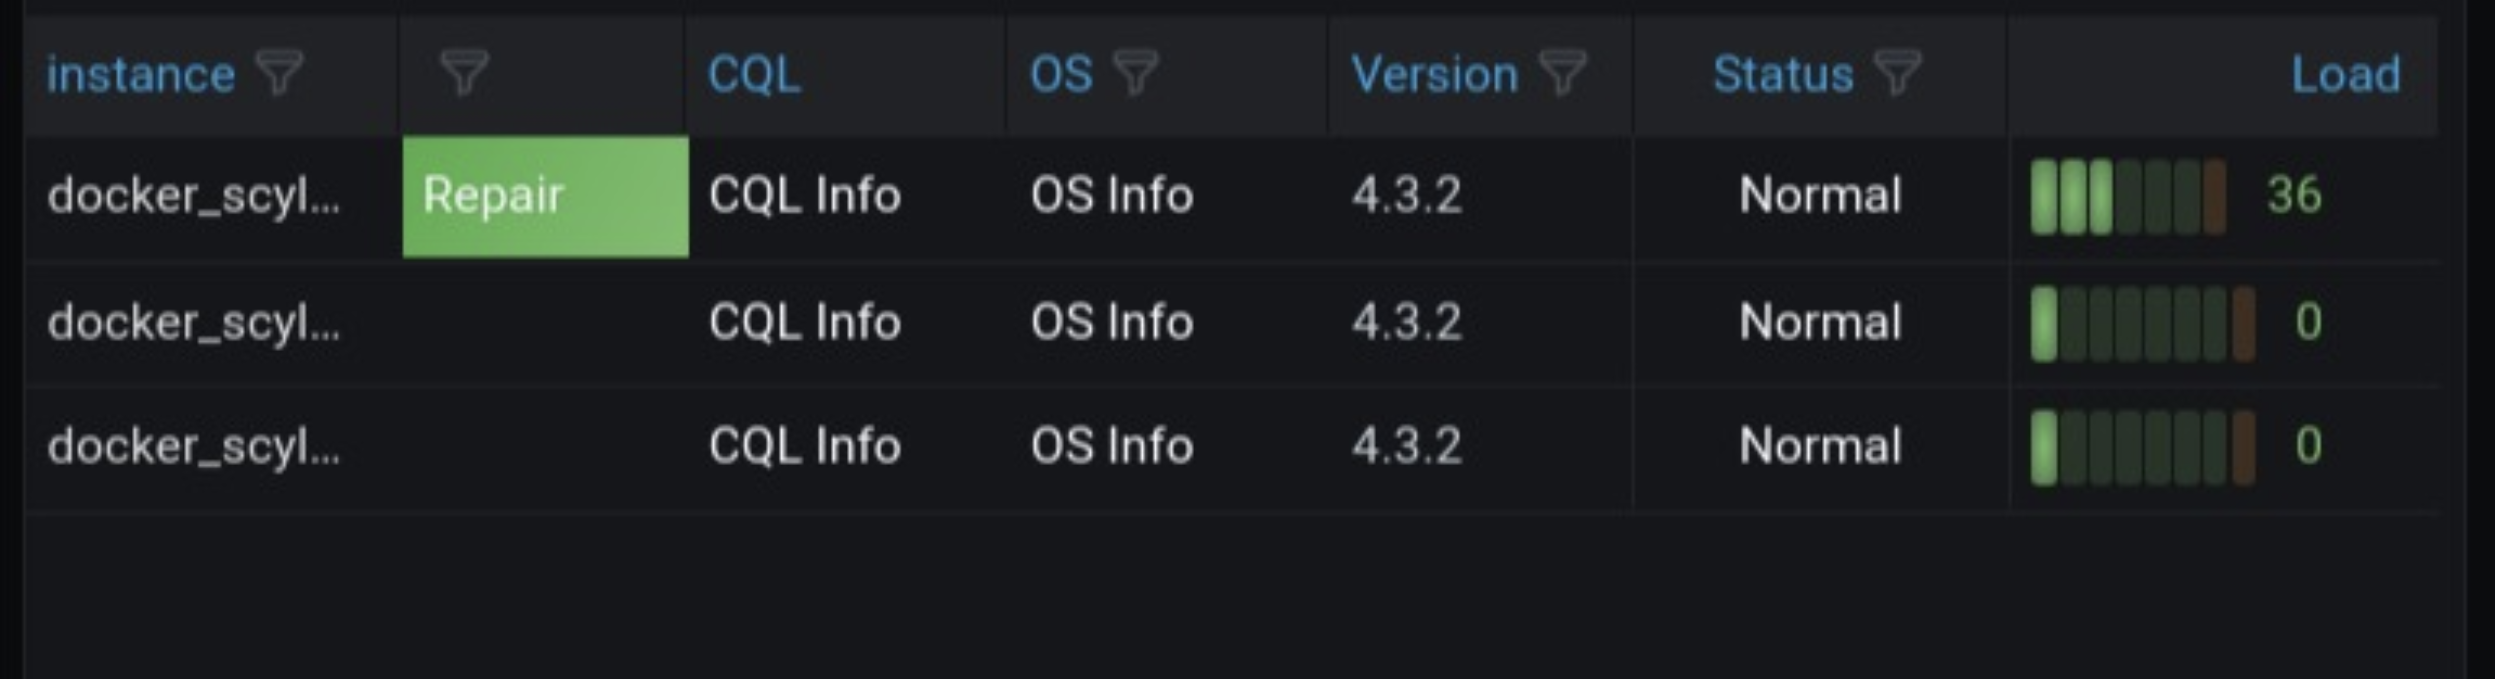
- Overview dashboard enhancements:
- Show that a repair is running in the node table #1420
- OS Dashboard
- new disk usage as percentage panel #1408:

-
- New available memory and CPU usage panels #1378, #1379
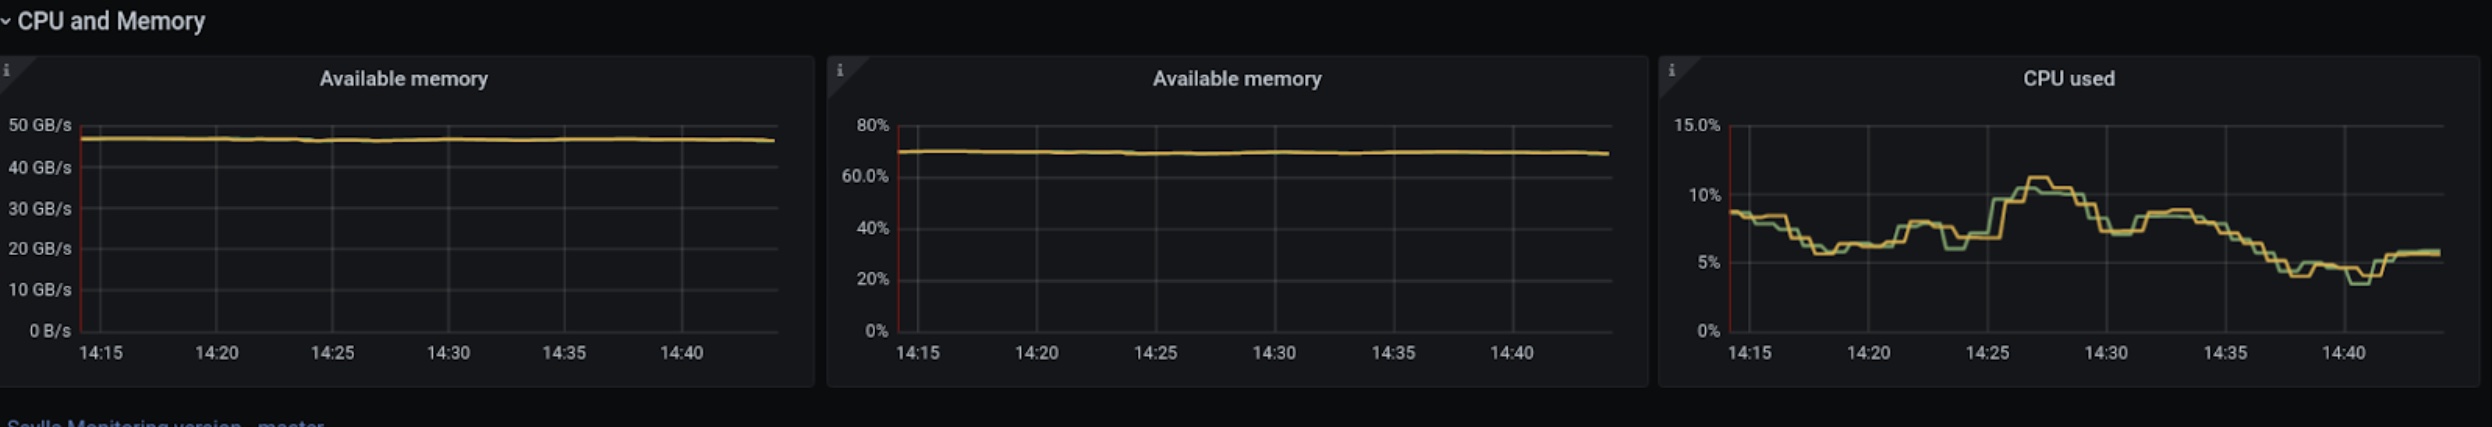
-
- A new await metrics #1343. Await is the average time for I/O requests issued to the device to be served. This includes the time spent by the requests in queue and the time spent servicing them (taken from iostat man pages). We expect the values to be in the order of ms, high await value will cause higher latencies. It could be a result of a problematic disk or that the iotune was not run.

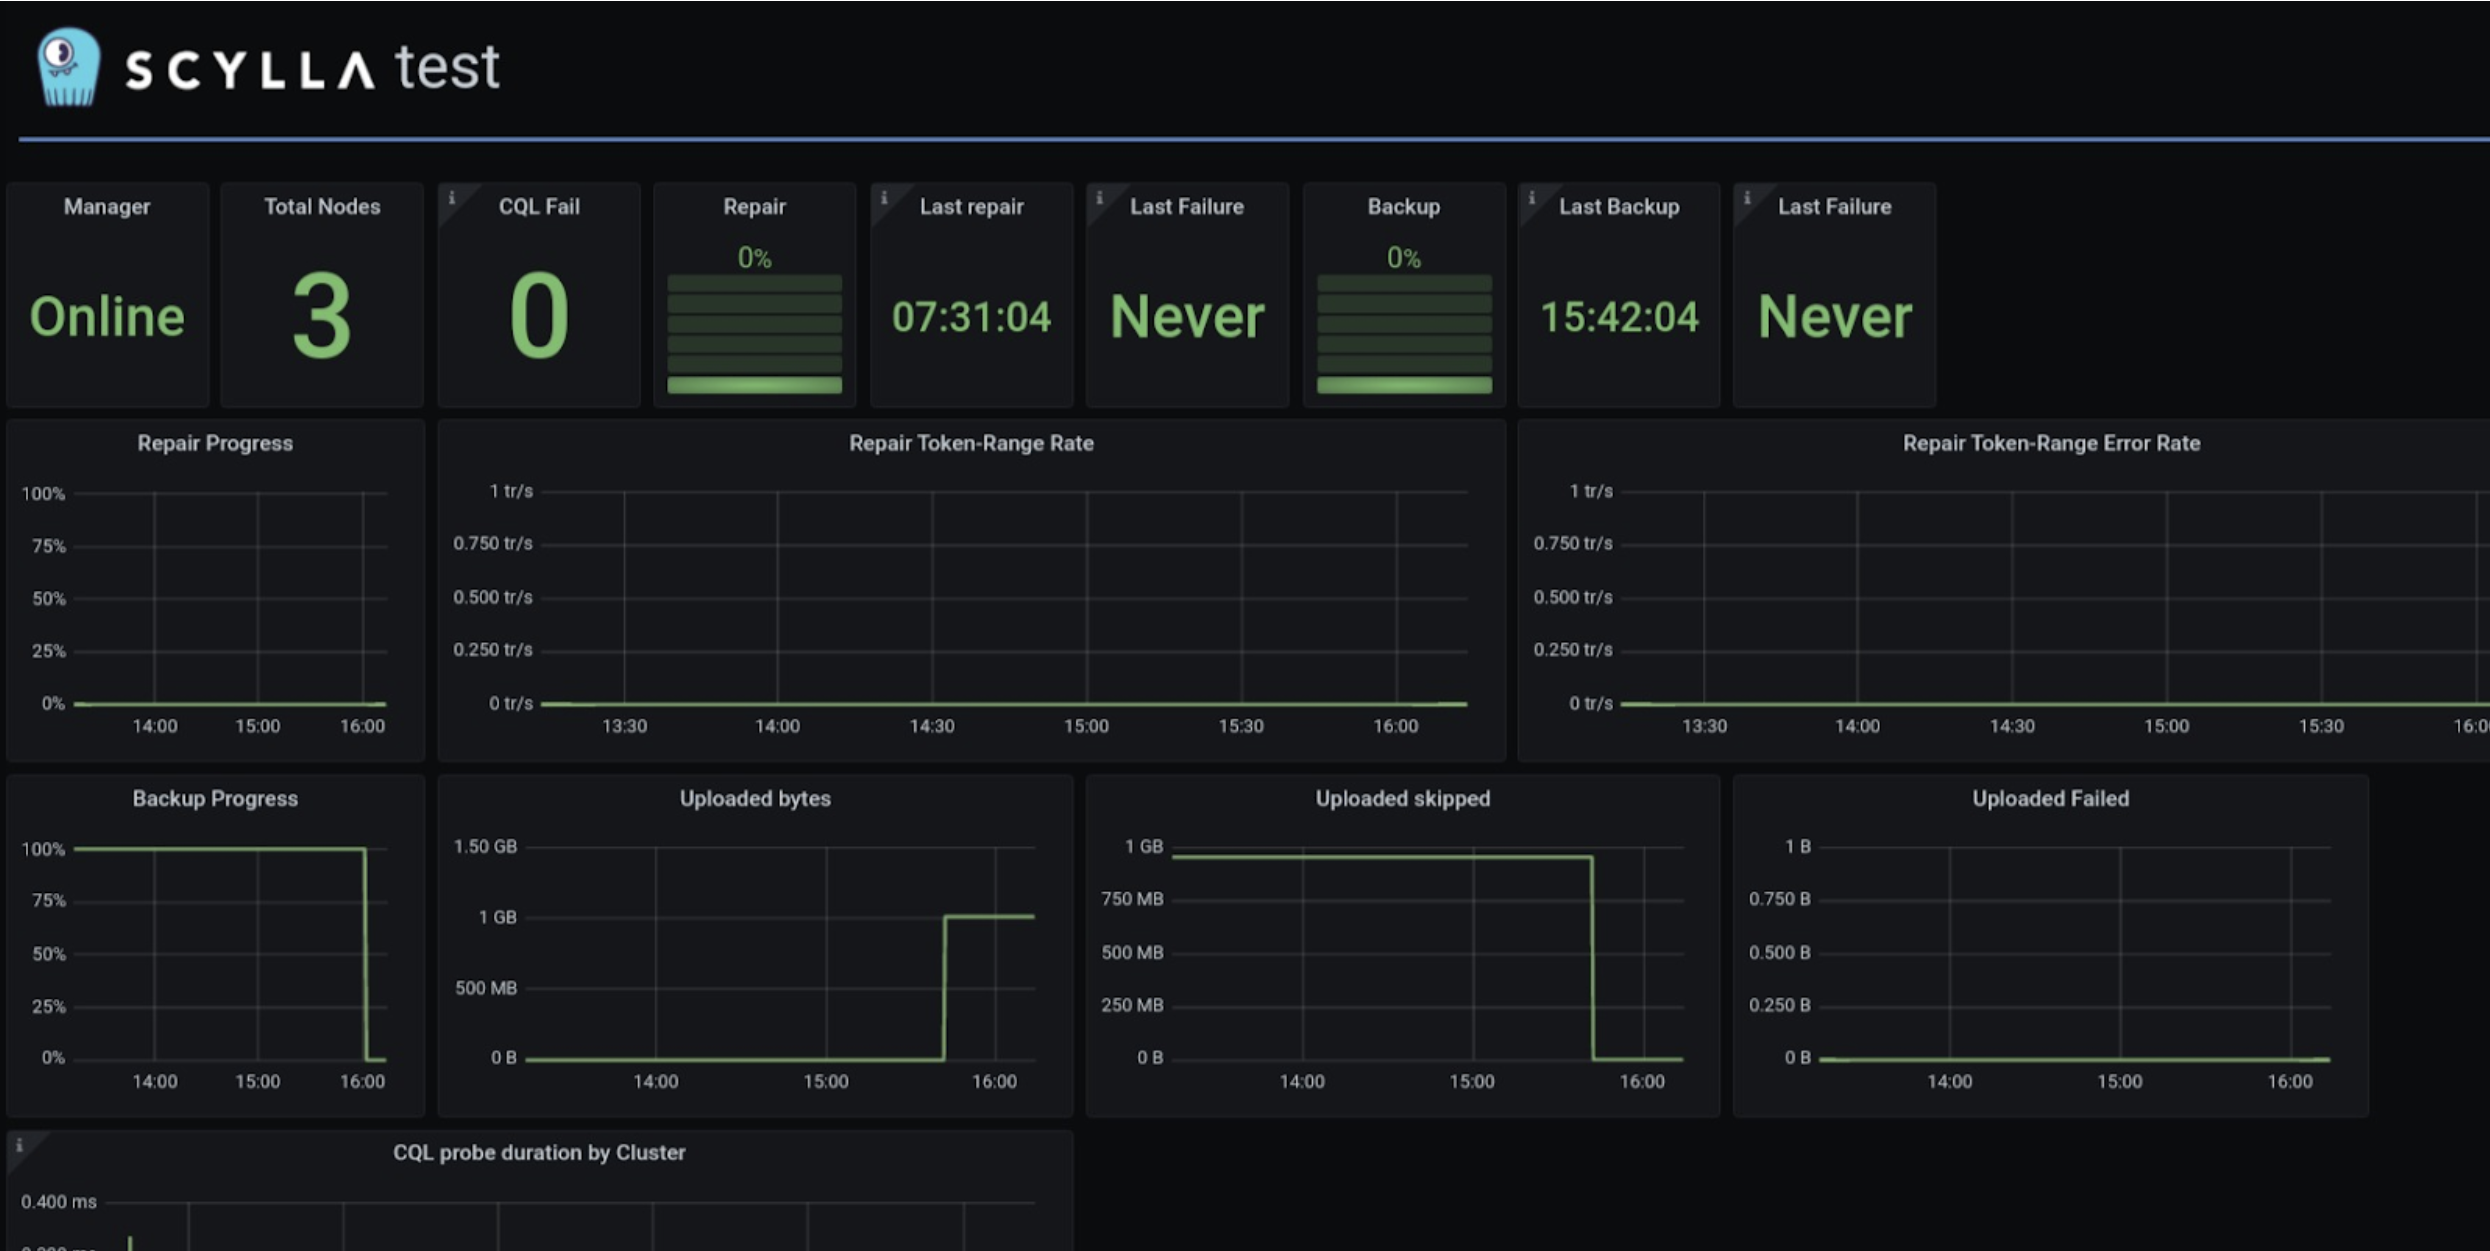
- ScyllaDB Manager Dashboard
- Add ScyllaDB-Manager 2.4 support
- Show the cluster name instead of the cluster id
- Add backup progress panels. ScyllaDB Manager supports backup to AWS S3, GCP Cloud Storage and very soon (in Manager 4.4) Azure Blob. The new panel allows you to track the progress of the backup process.
Bug Fixes
Operational Changes
- Prometheus alert-rules are now read from a directory #1432 this will make it easier to modify and add rules.
Important: if you are using your own rules, make sure to place them in your own file inside the directory. - Use recording rules for latencies calculation #1431 ScyllaDB monitoring uses more recording rules, it makes the dashboards work faster.
Important: If you edit in the past Prometheus alerts and recording rules, move your rules to your own file so that Prometheus would read the new recording rules that come with the release. - Support Thanos sidecar – when set a Thanos sidecar container would start as port of the monitoring stack which will allow to use Thanos to monitor multiple systems #1422
- Google Analytics, Grafana’s google analytics is now turned on.
- Verbose help and version information for the start-all.sh command.
- Warn if users start Prometheus without an external directory.
- Dashboard template version consolidation #1330 ScyllaDB Monitoring uses templates for dashboards generation. In the current version, each template will generate dashboards for all supported versions, this is only relevant if you create or modify dashboards by yourself.
- Obsolete generated dashboards in master. Working towards removal of the generated dashboards from master. The generated dashboards will only be part of a release, users should use a release or generate the dashboards themselves.
28 Jun 2021