The ScyllaDB team is pleased to announce the release of ScyllaDB Monitoring Stack 3.7.
ScyllaDB Monitoring Stack is an open-source stack for monitoring ScyllaDB Enterprise and ScyllaDB Open Source, based on Prometheus and Grafana. ScyllaDB Monitoring Stack 3.7 supports:
- ScyllaDB Open Source versions 4.2, 4.3 and 4.4
- ScyllaDB Enterprise versions 2019.x, 2020.x and 2021.x
- ScyllaDB Manager 2.2.x, 2.3.x
Related Links
- Download ScyllaDB Monitoring 3.7
- ScyllaDB Monitoring Stack Docs
- Upgrade from ScyllaDB Monitoring 3.x to 3.y
Version Updates for ScyllaDB Monitoring Stack Components
- set Prometheus version to 2.25.2 #1333
- Update the Alertmanager plugin to 1.0 #1288
- Switch the Alertmanager to the new table panels #1071
New in ScyllaDB Advisor
- New Advisor feature: more detailed advice. (Learn more about ScyllaDB Advisor here.)
New in ScyllaDB Monitoring Stack 3.7
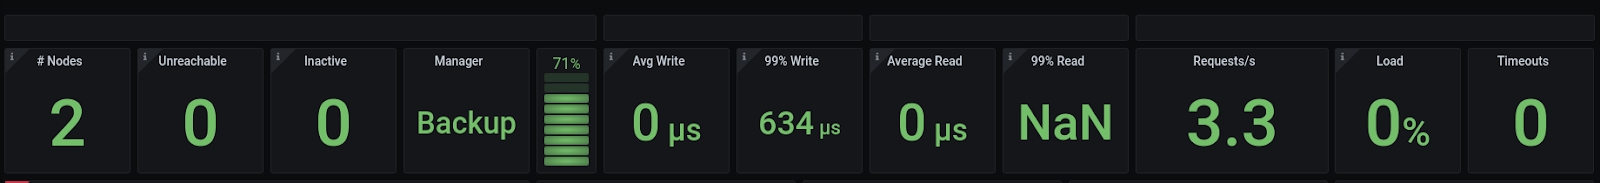
- Overview dashboard enhancements:
- Add manager task progress indication to the overview dashboard #1250
The Manager progress is now part of the header rows, for example, this is how a backup looks like:
- Add manager task progress indication to the overview dashboard #1250
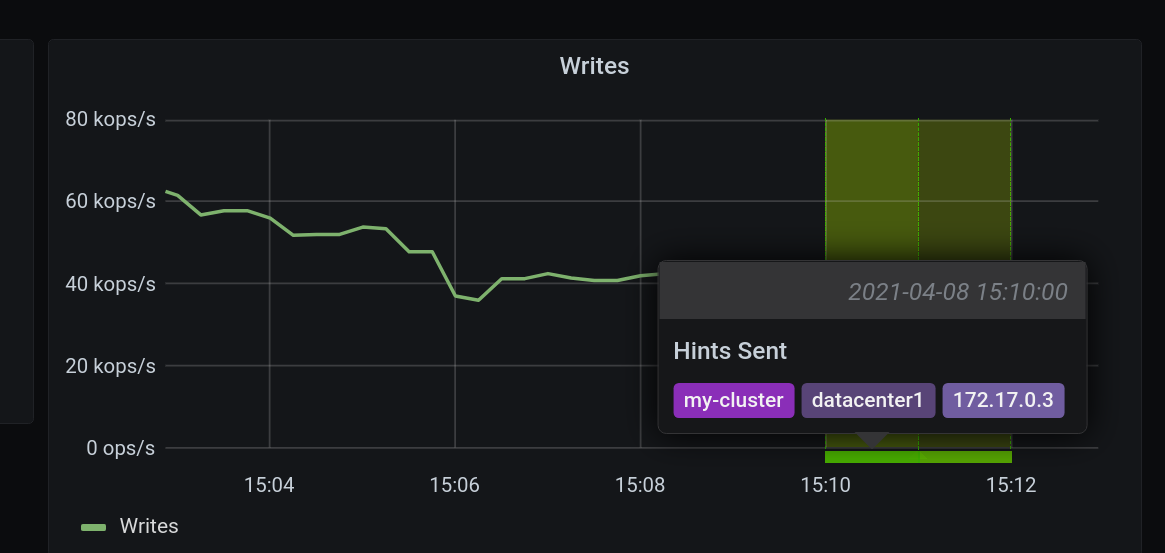
- Hinted handoffs being accumulated/being sent – annotation #1258
When a node is temporarily down, the updates that would have been sent to it are stored as hints, when the node is up again, those hints are sent. This translates to extra load on other nodes. There are optional annotations for storing and sending hints.
- Secondary Indexes/Materialized Views background-built – annotation #1257
When adding a Secondary Index or a Materialized View to an existing table, the new index will be built in the background. This will add extra load on the nodes. You can use the MV annotation to see when a Materialized View or Secondary index is being built. - Provide an indication of coordinator / replica errors per node #1229
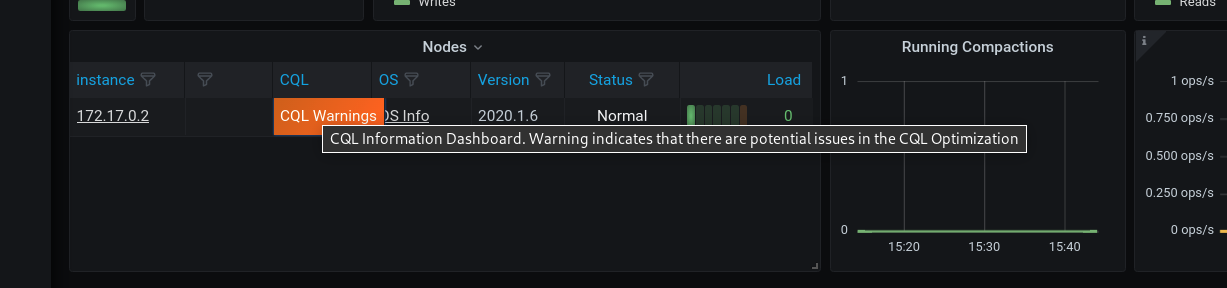
Visually present error/no error on the node table #1035
The Node Table, found on the DC section that is part of the overview dashboard, can indicate when there are CQL optimization warnings, and when there are errors on the node.
- CQL Dashboard
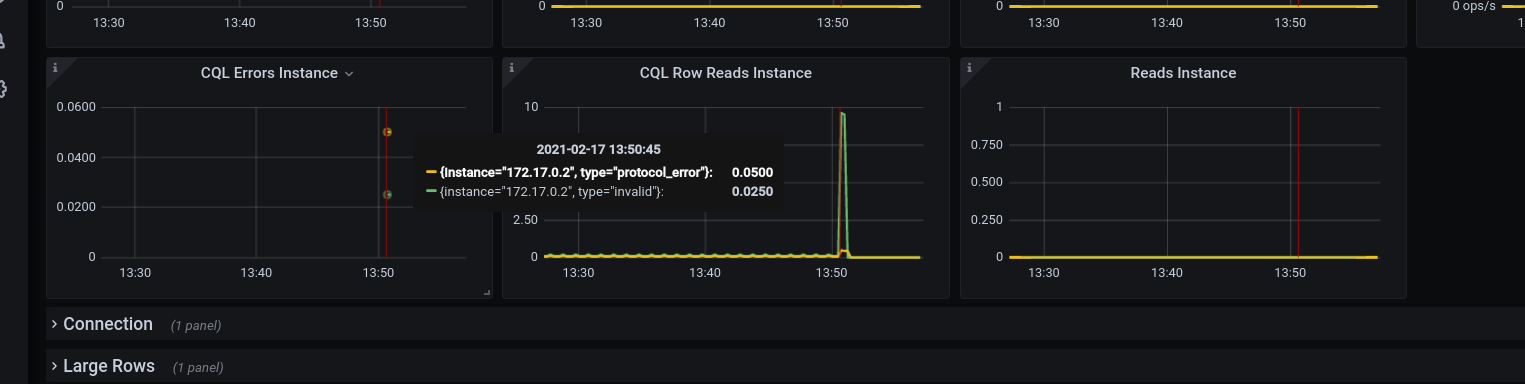
- Add CQL errors to dashboards #1276
ScyllaDB 4.4 comes with additional CQL errors. The new CQL Errors panel, found on the CQL dashboard, will show those errors. Please note, that for clarity, only active errors will be shown.
-
- Add more info to client table (ScyllaDB Open Source 4.4) #1259ScyllaDB Open Source 4.4 adds additional information to the client table found on the CQL dashboard.
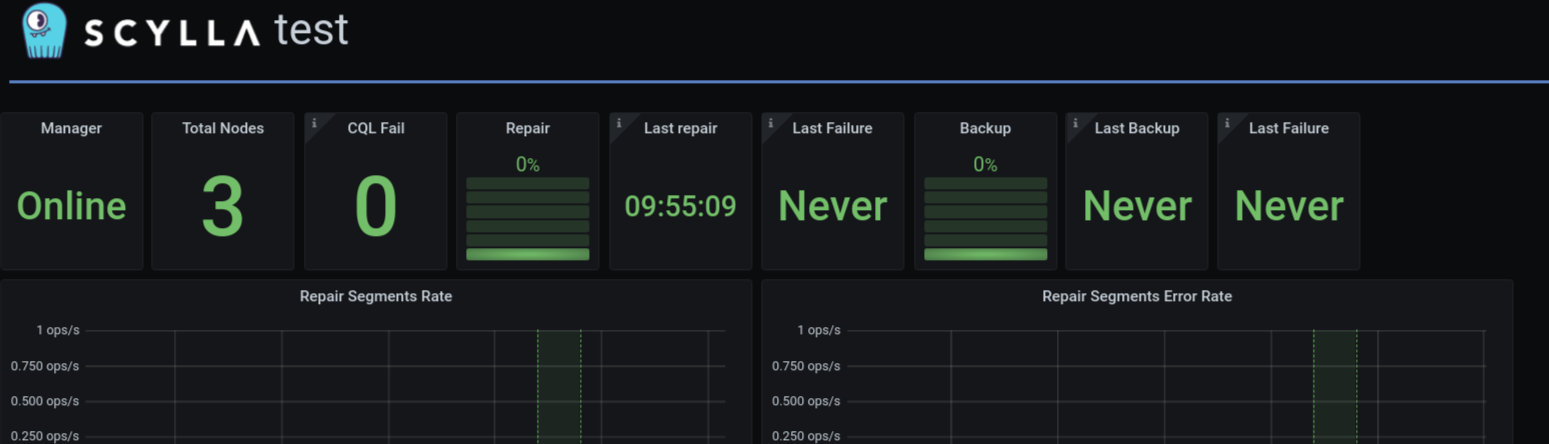
- Update ScyllaDB Manager Dashboard #1180
The manager dashboard got a facelift. It now shows the last success and last failure of Backup and Repair tasks.
- Panel for ScyllaDB HWLB #907
Heat Weighted Load Balancing (HWLB) is an optimization mechanism that distributes queries according to the probability a requested value will be in the cache.
Bug Fixes
- Loki container breaks -A option in start-all.sh #1326
- Inconsistent use of legends in DC panel #1290
- Disk space alerts not working due to wrong metrics used #1282
- When using a private network Loki and Alertmanager do not work #1252
26 Apr 2021