The ScyllaDB team is pleased to announce the release of ScyllaDB Monitoring Stack 3.10.
ScyllaDB Monitoring Stack is an open-source stack for monitoring ScyllaDB Enterprise and ScyllaDB Open Source, based on Prometheus and Grafana. ScyllaDB Monitoring Stack 3.10.0 supports:
- ScyllaDB Open Source versions 4.3, 4.4, 4.5 release and the future 4.6
- ScyllaDB Enterprise versions 2020.x and 2021.x
- ScyllaDB Manager 2.3.x, 2.4.x, 2.5.x, 2.6.x
This release brings new panels and graphs, new Advisor advice, bug fixes and stability improvements.
Related Links
- Download ScyllaDB Monitoring 3.10
- ScyllaDB Monitoring Stack Docs
- Upgrade from ScyllaDB Monitoring 3.x to 3.y
Versions updates ScyllaDB Monitoring Stack 3.10
- Set Prometheus version to 2.32.0 #1627
- Set Grafana version to 8.3.3 #1627
- Update Loki to 2.4.1 #1627
- Update the Alertmanager version to 0.23.0 #1627
New in ScyllaDB Advisor
(Learn more about ScyllaDB Advisor here.)
- Warn when more than 1% requests are shed – the requests that were shed due to overload (threshold configured via
max_concurrent_requests_per_shard) - Warn when compaction overuses the CPU — A situation that can happen if the ScyllaDB scheduler changes the background compaction process’s priority.
New Information in ScyllaDB Dashboards
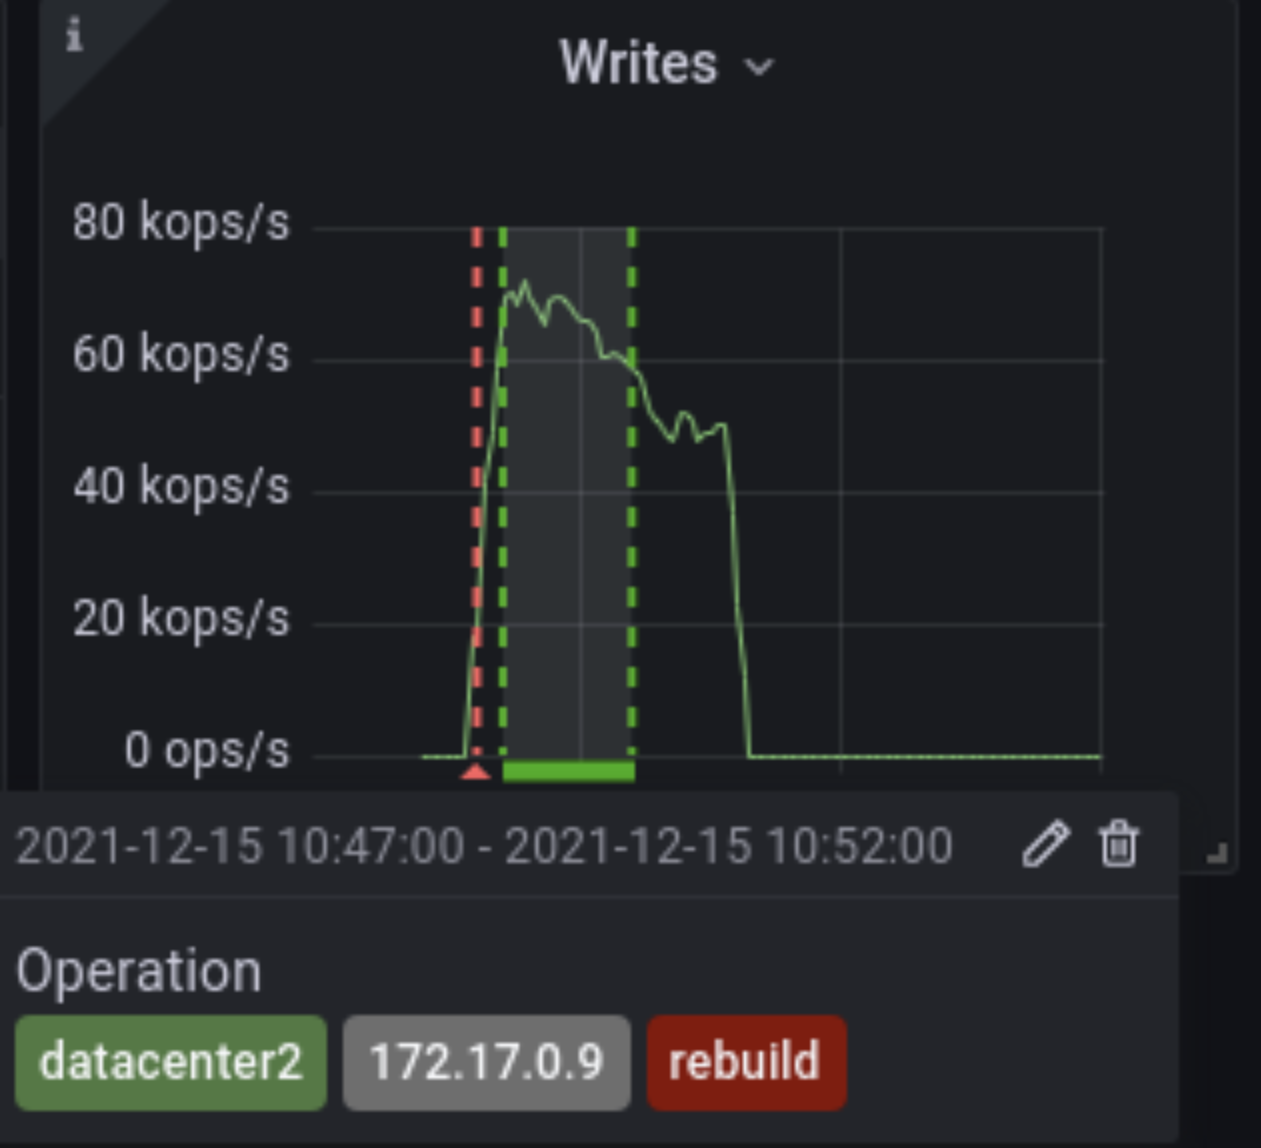
- Add annotations for repair based ops (RBNO). In ScyllaDB 4.6, RBNO is enabled by default only for replacing node operation #1622
- Detail dashboard enhancements:
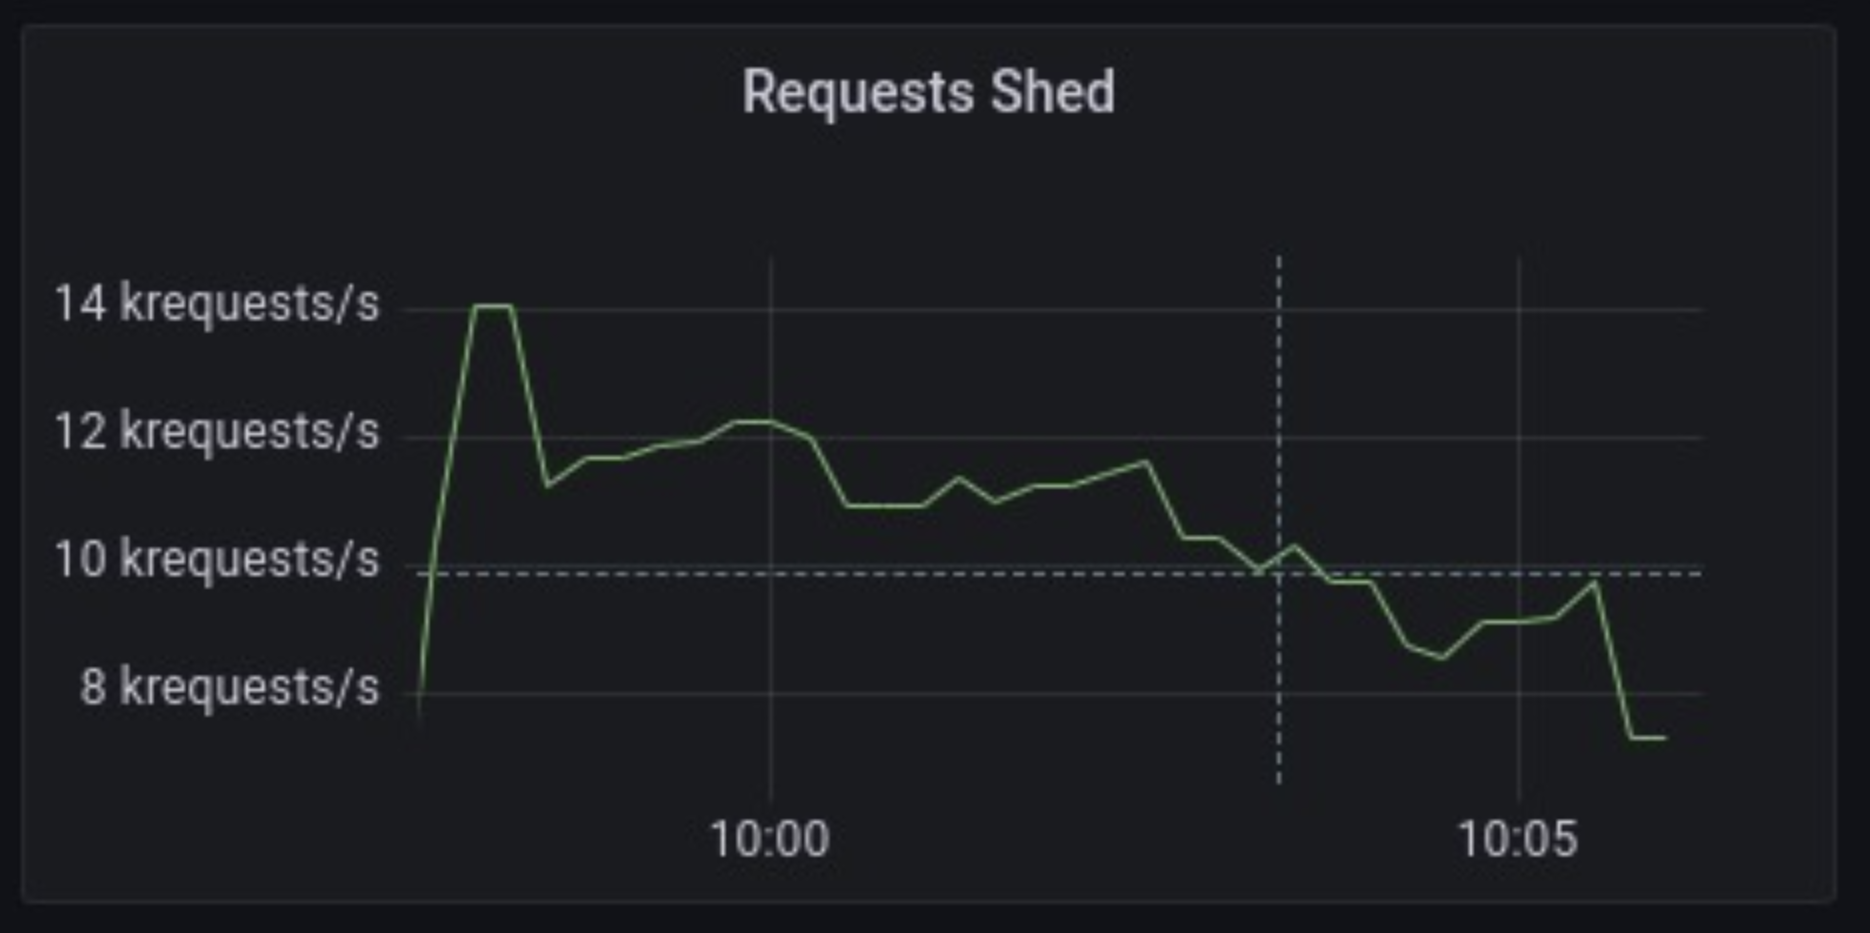
- Add shed requests panel #1619
-
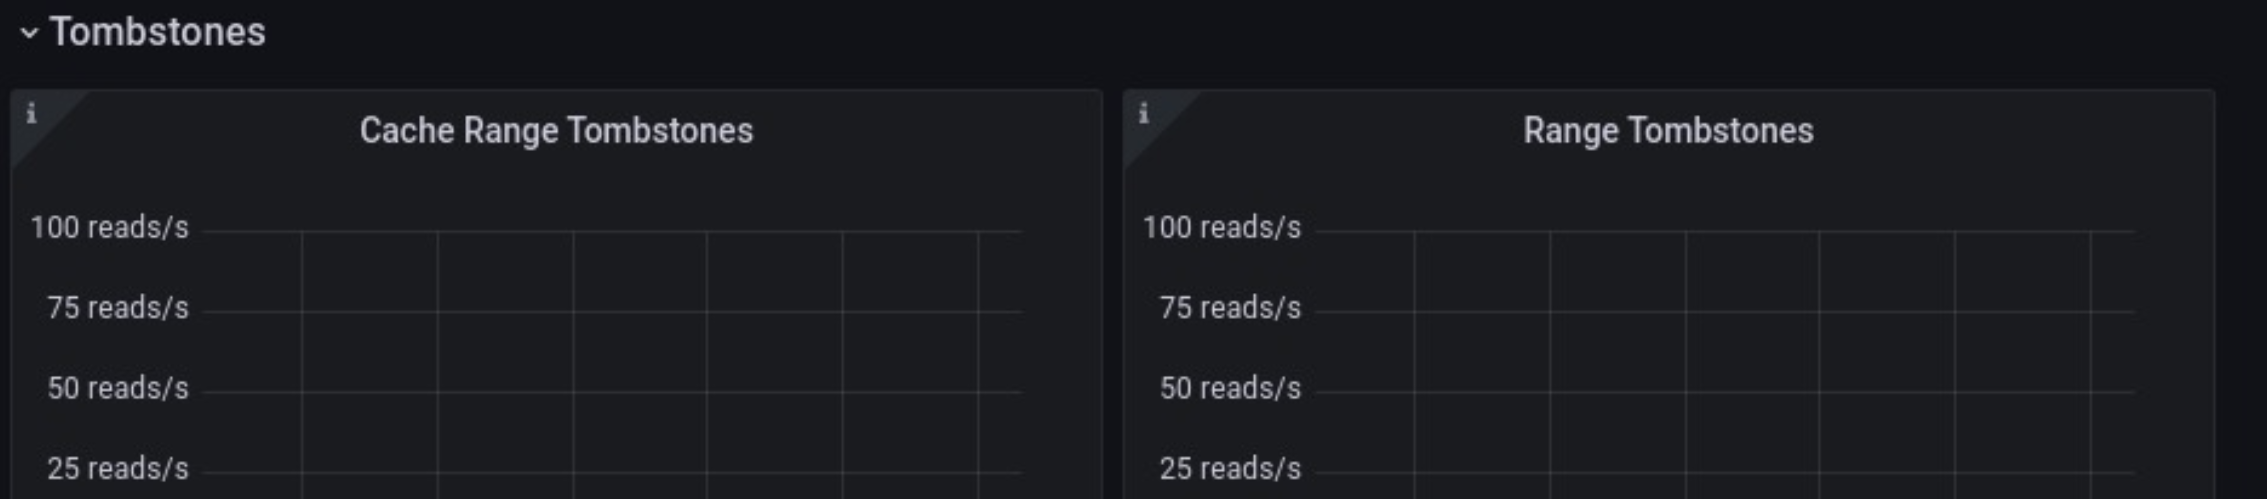
- Add tombstone section #1618
-
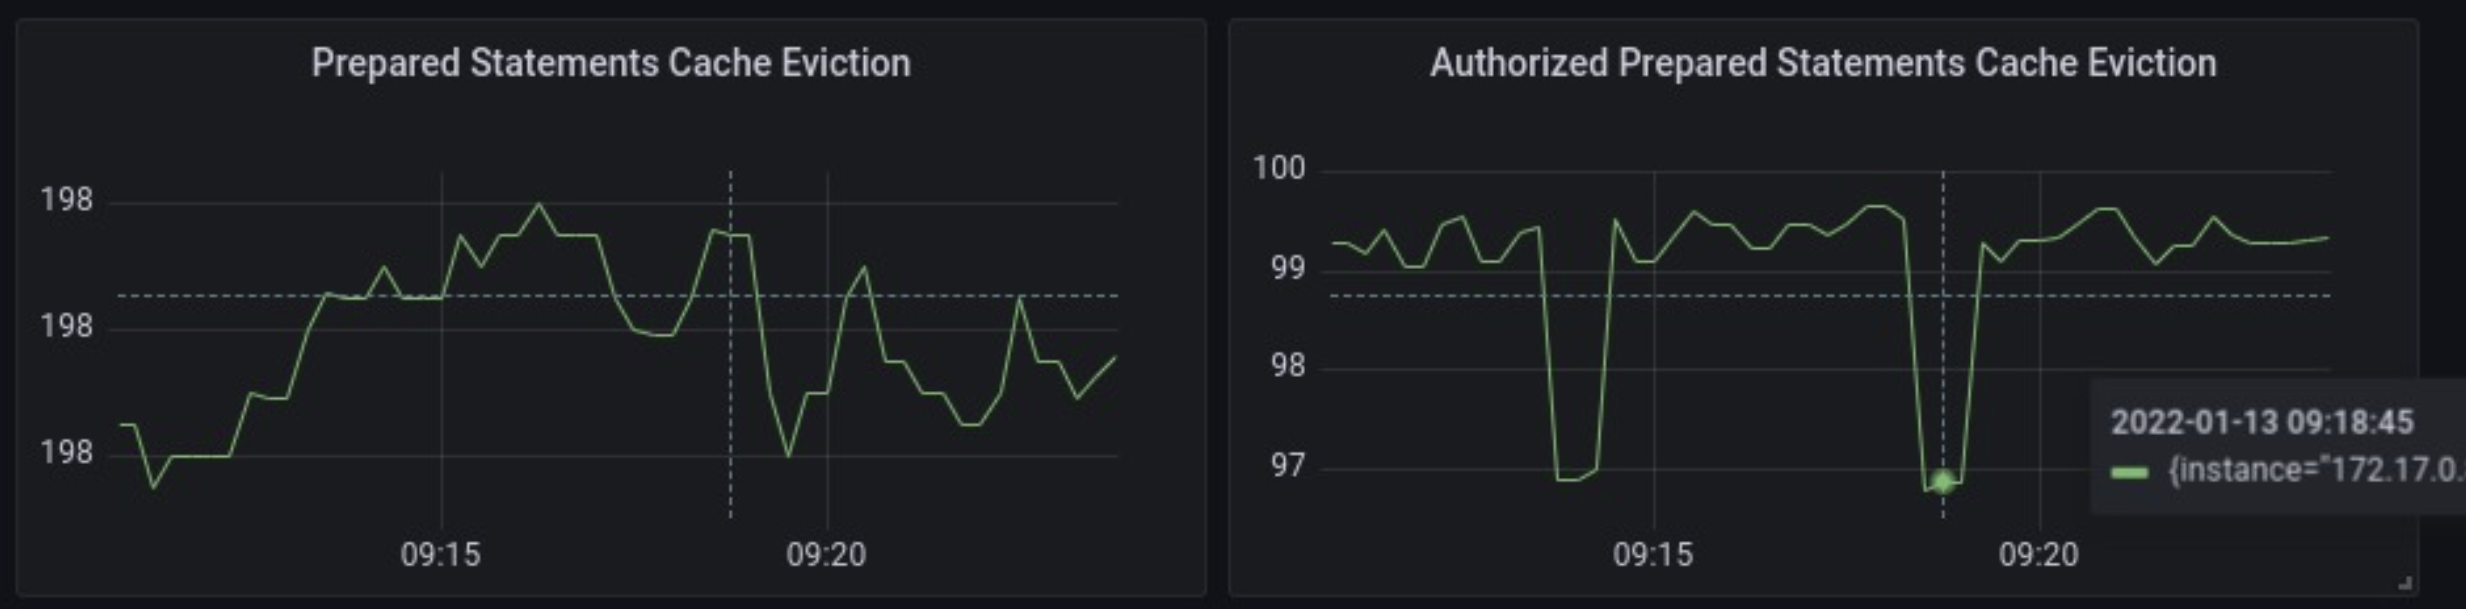
- Add graph for prepared statements cache #1615
- CQL Dashboard
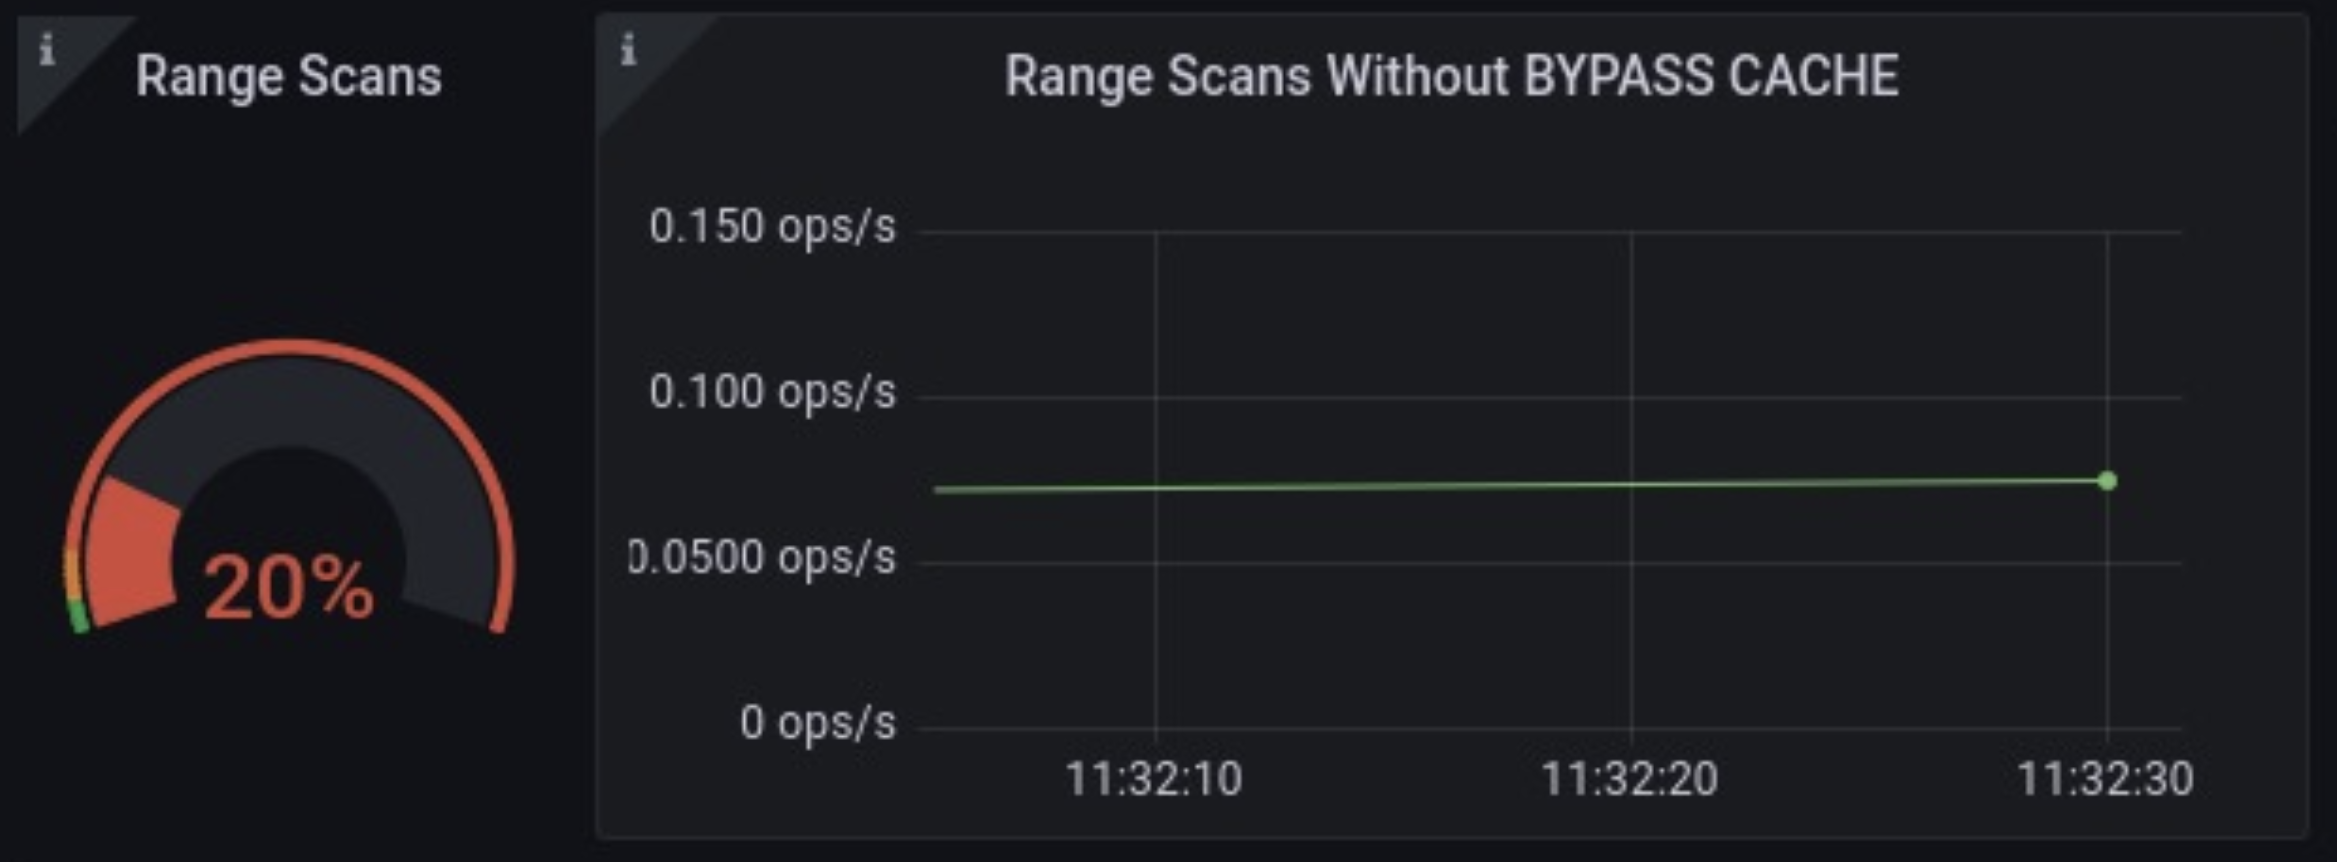
- Add the number of partition range queries without BYPASS CACHE #1613
A partition range is mostly used to scan a full table. In most cases, it does not make sense to cache these scans, since it will quickly fill up the cache with partitions.
-
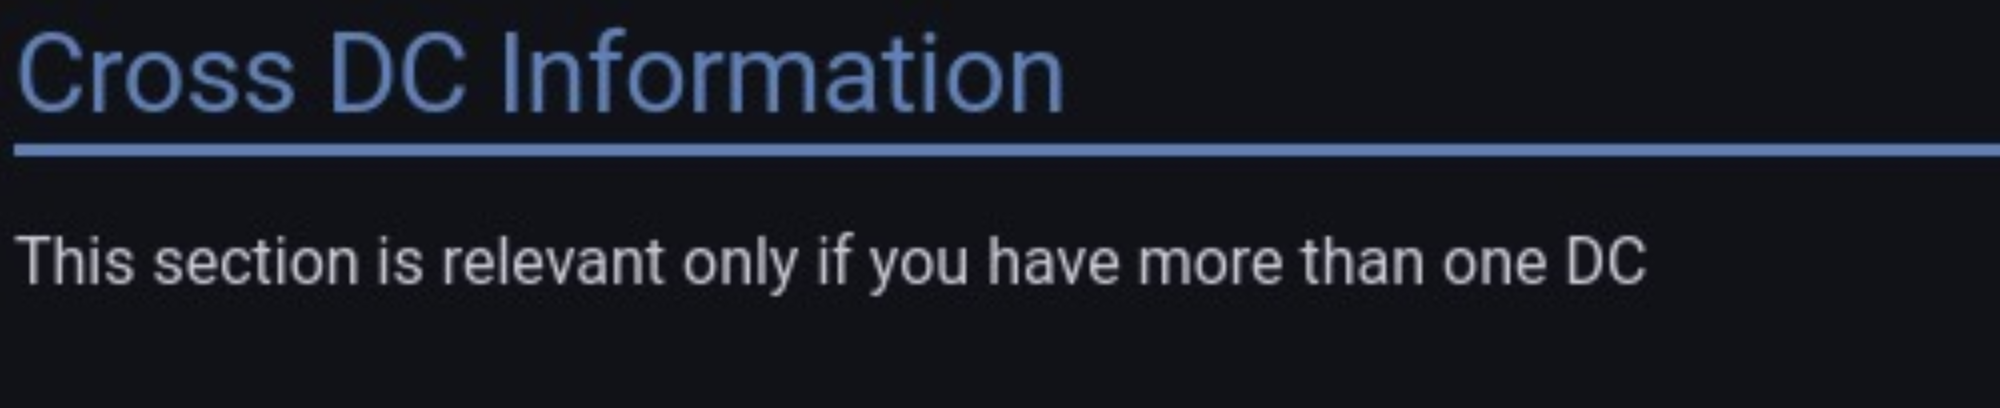
- Cross DC Information – Explained #1571
- Keyspace Dashboard:
- Link to enable metrics #1560
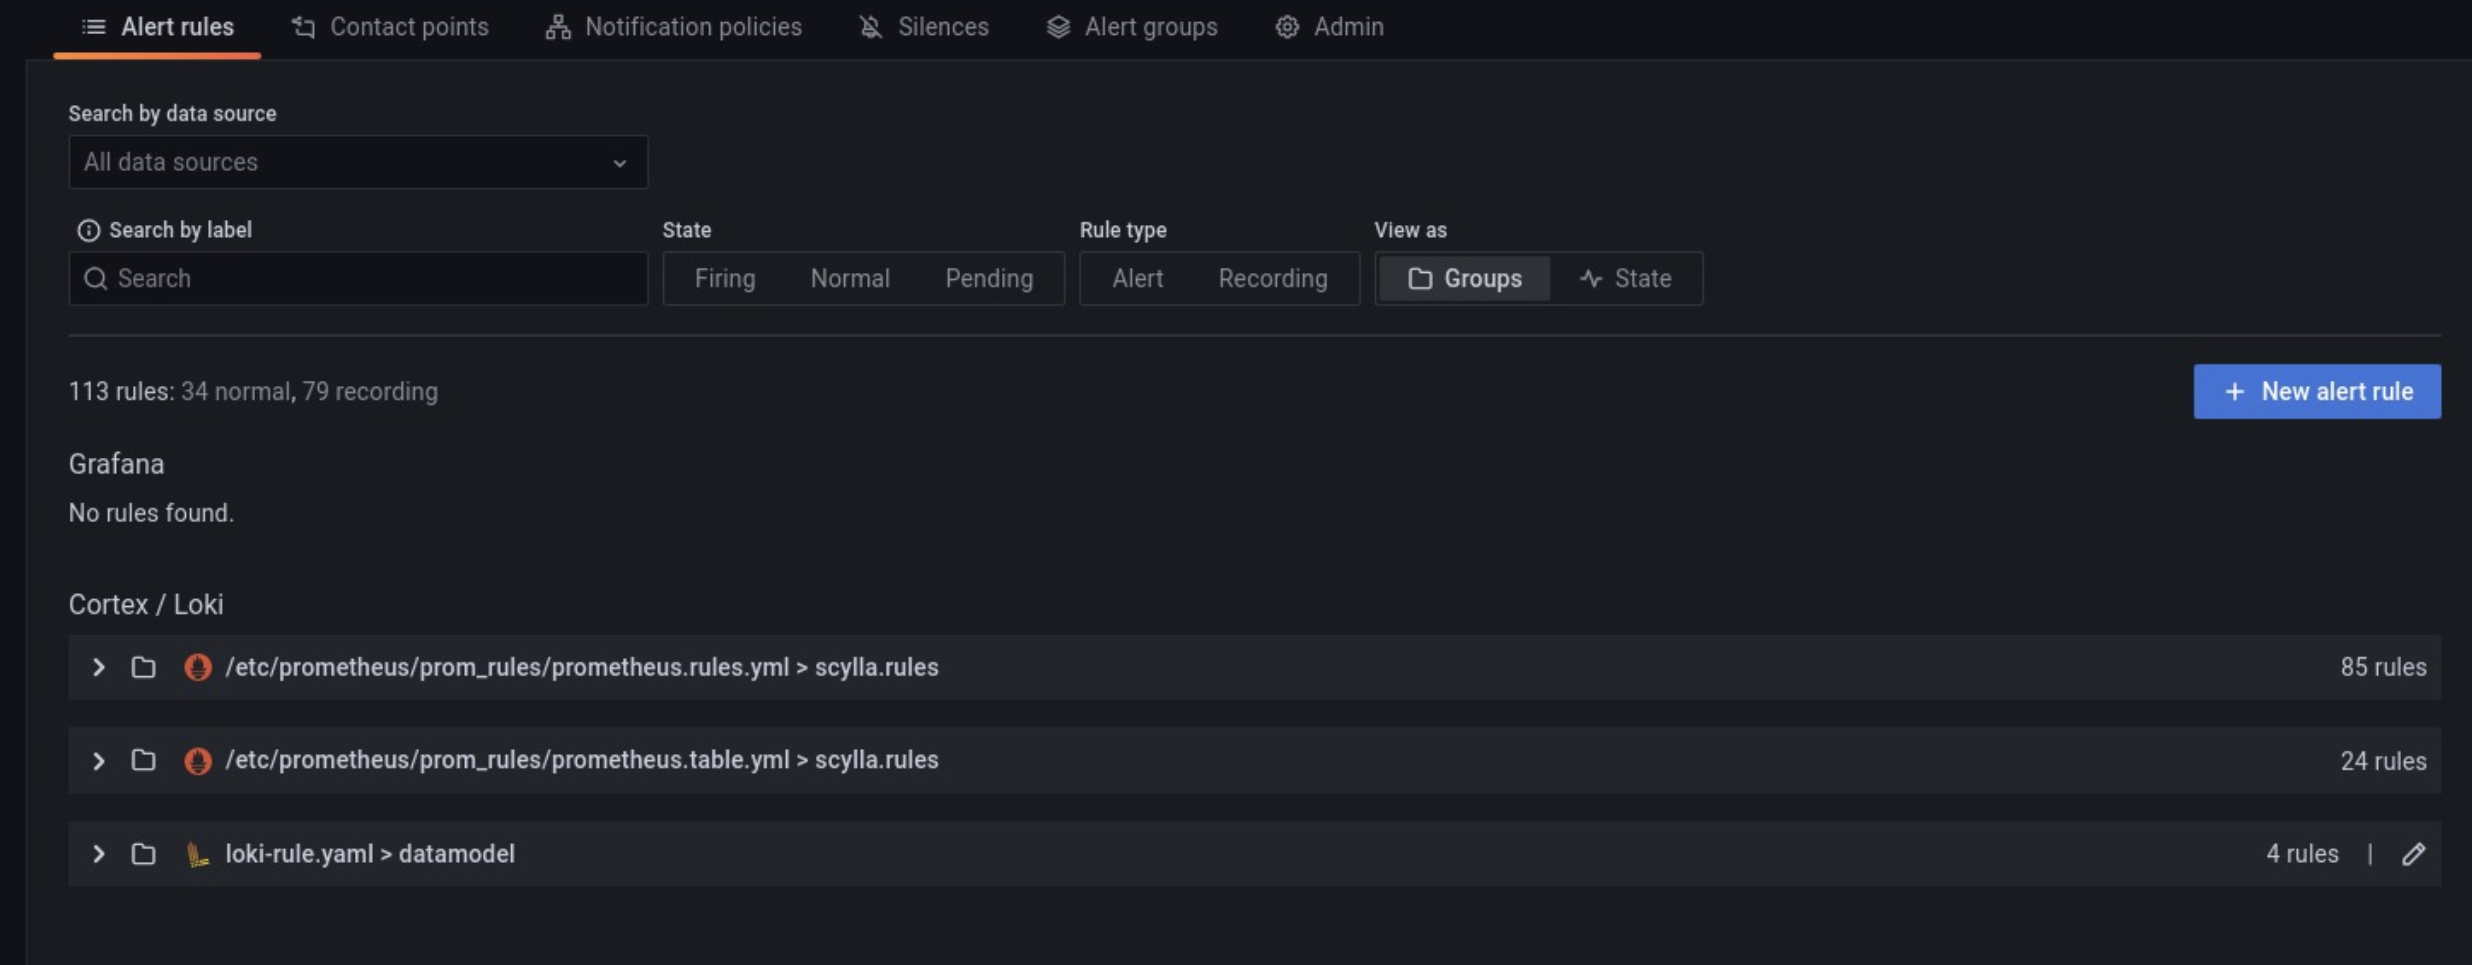
- Alert tab
Grafana 8.3 has the centralized Alerting on by default, which means that you can have an overview of the alerts directly from the Grafana dashboards by switching to the Alert tab
Bug Fixes
start-grafana.sh -v: binary operator expected #1591- Write latencies missing shard id bug #1562
start-all.shfails in master branch when called without-vwithout proper warning #1569
Operational Changes
- systemd service to keep monitoring running even after reboot #1564
17 Jan 2022