This is the second and last part of this article. If you haven’t read the first part, you can do it here. In this part, we will look at the design of the Seastar I/O Scheduler that ScyllaDB uses to manage its disk I/O and discuss how it can be used to not only provide predictable latencies as we saw in our previous installment, but to guarantee fairness and proper balancing among different actors.
At the end of this article you should understand, among other things, why there is no need for ScyllaDB to have the commitlog on its own disk, and how ScyllaDB can manage to keep read latencies for cache misses low even in the face of extremely heavy write workloads, and vice versa.
Seastar Disk I/O Scheduler Design – The I/O Queues.
It is the job of every kind of scheduling algorithm to maintain fairness among the classes it schedules, proportional to predefined priorities. This case is no different. In our context, we will call those classes priority classes. To illustrate that, let’s use a simplified example before we can talk about ScyllaDB’s actual priority classes.
Say for instance that we would like to balance, in our simplified example, disk reads and disk writes. The classes in this example would be simply “reads” and “writes”, and we will establish that each should be served with equal priorities. In our terminology, we will say that requests associated with “reads” and “writes” belong to different priority classes, each of them with the same number of shares.
Let’s remember from the first installment that for each disk configuration, we will determine how many requests should be in flight at the same time. We will call this the global I/O depth. But how do all of the different processing units, or shards, submit their requests?
Seastar employs a shared-nothing architecture. This means that all communication between shards has to happen explicitly. Because the disks and their associated global I/O depth are naturally global resources, we need to somehow connect the global limits with the local engines.
The easiest way to do that is just to divide the capacity between the existing shards. For example, a system configured with --max-io-requests 120 and 12 processing units will just allow each shard to drive 10 concurrent requests at a time. This kind of partitioning is not without its own fragmentation issues, but is in line with how Seastar divides other global resources such as available memory. It works well if the workload is more or less equally divided between the various shards over time.
If a given disk setup has a very low parallelism number, such that --max-io-requests is less than nr_processors, each processor would end up having a maximum local I/O depth of 1. The problems with that are twofold: first, this will effectively increase the global I/O depth to nr_processors, which can start hurting our overall performance. But also, with such a configuration we will never be able to exploit local parallelism when it exists – even if the disk as a whole is momentarily underutilized and the other shards are busy in CPU-bound processes at the moment.
Because of that, disk I/O in Seastar is not divided by shard, but by an “I/O Queue”. If the disk setup has a big enough global I/O depth, each shard will have its own I/O Queue. In that case, every request is shard-local, and that is obviously the best case scenario for Seastar. But commonly there will be fewer I/O Queues than shards, leaving us with more than one shard associated with each I/O Queue. This means that each I/O Queue can claim for itself a slice of the global I/O depth that allows for local parallelism, called the queue’s local I/O depth.
Figure 1 shows an example of a system with high enough global I/O depth. Each shard will connect to its own I/O Queue, which will now accept requests from the priority classes reads and writes, which it will balance. Each I/O Queue will have a local I/O depth that is equal to the global I/O depth divided by the number of shards. Figure 2 shows an example of a system in which the global I/O depth is not deemed enough to grant each shard its own I/O Queue. In this particular system, two shards will connect to each I/O Queue and each of them will have a local I/O depth equal to the global I/O depth divided by the number of I/O Queues. In this example, that is half the number of processors.
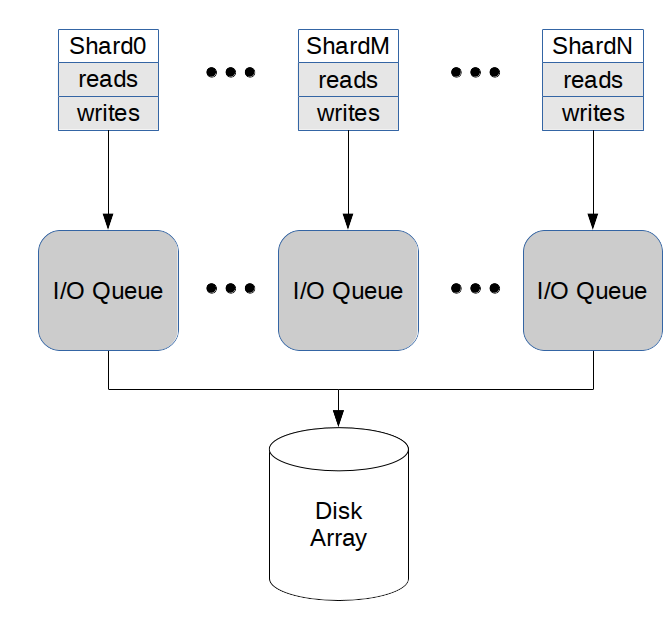
Figure 1: each shard connects to its own I/O Queue. All I/O Queues will talk to the same disk array and will have a local io_depth of global_io_depth/num_shards each.

Figure 2: two shards share the same I/O Queue. All I/O Queues will talk to the same disk array and will have a local io_depth of global_io_depth/num_io_queues each.
In scenarios like the one in Figure 2, where requests for an I/O Queue can potentially come from more than one shard, it is also important to keep fairness among them. Internally, each I/O Queue in this example will map requests for each priority class as “reads-0”, meaning “requests from reads class, generated by shard-0”, and by analogy “reads-1”, “writes-0”, “writes-1”, and so on for each pair of shards.
However, it is important to notice that the goal of the Seastar scheduler is to balance priority classes, not shards. For the various priority classes managed by the I/O Queue, it is possible to set the ratios among them to whichever value we want in order to achieve the level of balancing we want. But for the different shards, the I/O Scheduler will always try to maintain a fair allocation among them.
Choosing the right number of I/O Queues
Physically, each I/O Queue will be placed in one of the shards, called the I/O coordinator for that queue, and never moved. To reduce the cost of data access between the coordinator and the issuing shard, which could either be the coordinator’s shard itself or a foreign shard, all shards attached to an I/O Queue have to live in the same NUMA node. Due to that restriction, the minimum number of I/O Queues is equal to the amount of NUMA nodes in which the server is run.
Seastar includes an extra parameter, --num-io-queues, that allows the user to select how many I/O Queues are created. The fewer queues, the more local parallelism can be exploited, at the expense of more cross-shard messages. Conversely, the more queues, the less local parallelism can be exploited, but fewer cross-shard messages will be needed to drive I/O.
To demonstrate that in isolation, we will run the fair_queue_tester example program included in Seastar, that is designed to explore the various I/O Queue configurations.
Table 1 summarizes the results obtained by running it for 60 seconds with 4KB requests in a 6-core processor driving a Samsung 850 PRO SSD, which has a global I/O depth of 30. We will run a single class with a single I/O Queue, and then repeat the test with 6 I/O Queues.
We can see in the table that when there is a single I/O Queue in the system, with a local I/O depth equal to the global I/O depth at 30, all shards balance perfectly. However, the overall throughput is up to 20% lower, due to the fact that all 6 shards now need to communicate with a single shard to push their I/O through. In the case where there is one I/O Queue per shard, with a local I/O depth of 5, there is no attempted balancing among the shards, since the I/O Queues are independent, but the system can now push a higher throughput due to the fact that all I/O is shard-local.
| Throughput (KB/s) | ||
| 1 I/O Queue (KB/s) | 6 I/O Queues (KB/s) | |
| Shard 0 | 50348 | 61578 |
| Shard 1 | 50348 | 62310 |
| Shard 2 | 50348 | 62335 |
| Shard 3 | 50348 | 62269 |
| Shard 4 | 50348 | 62301 |
| Shard 5 | 50348 | 62342 |
Table 1: bandwidth for a single class in a 6-core server with 1 I/O Queue and 6 I/O Queues. Having each shard communicating with its own local I/O Queue produces better throughput numbers.
It is also important to note that as the request size grows, this communication overhead matters less on a per request basis, and is expected not to play such a large role with more typical sizes like 128KB. This difference will also matter less and less as we approach the line rate for the device. In Table 1, we can see that the total throughput sits around 367 MB/s, which is short of the advertised 550 MB/s. But this is not at all bad for 4K requests, and allows us to see the difference in behavior for the differing I/O Queue setups. In the examples section, we’ll use a similar example and see how Seastar can easily saturate this device.
In a real system, requests are expected to be of various sizes, and it is still important to have as many I/O Queues as possible. For ScyllaDB, we require the number of I/O Queues to be such that each one has a local I/O depth of at least 4. This is what we have found empirically to be the best compromise. A system where each shard can drive at least 4 requests (global I/O depth >= 4 * nr_shards ) can execute without any cross-shard messages.
None of those details should, however, concern any ScyllaDB user: as it is the case with the number of requests itself that we have covered in our previous installment. The scylla_io_setup script (a wrapper around Seastar’s iotune tool) will also help selecting a good value here. Those values are preloaded in official Amazon EC2 AMIs provided by ScyllaDB.
Priority classes in ScyllaDB
For a complex application like ScyllaDB, it is not enough to keep reads and writes balanced. For our version 1.0, ScyllaDB assigns I/O into 6 different priority classes (plus Seastar’s default priority class). They are all are statically defined in priority_manager.hh , and summarized in Table 2:
| Priority class | Shares |
| Commitlog | 100 |
| Memtable writes | 100 |
| Compaction (reads and writes) | 100 |
| CQL query read | 100 |
| Repair / Streaming reads | 20 |
| Repair / Streaming writes | 20 |
Table 2: priority classes in ScyllaDB 1.0
Internal Functioning of an I/O Queue
Each I/O Queue has, internally, a Seastar Fair Queue. The fair queue is designed to balance requests originating from multiple priority classes. For each priority class i we associate a shares (s) parameter. Priority classes with the same number of shares will receive equal allowances, while a class with twice as much shares as another will receive twice as much allowance. That balancing is expected to happen over a specific time window (????), which ScyllaDB will set to the default of 100ms.
The fair queue will allow N requests to be submitted simultaneously, and we will set that to be the I/O Queue’s local I/O depth. Since requests submitted through the queue may have different sizes, an equal shares allowance will not necessarily translate into balanced disk bandwidths. To mitigate that, the fair queue allows for the specification of an associated weight (w). For ScyllaDB, every request submitted through the queue will set its weight according to a sub-linearly increasing function of the request size. The sublinear behavior is designed to reflect the fact that pushing a request into the disk has an initialization cost, so that for a given transfer size, issuing fewer, larger requests will be favored compared to issuing more, smaller requests.
For each and every request that the queue allows in at a time t, a cost is calculated as follows:
c0 = w⁄s.
Each priority class will internally keep an accumulator with the cost of all requests it has dispatched, which we will refer to as the priority class’ total cost.
After a new request with cost c0 is executed and properly accounted for, all priority classes’ total cost are multiplied by e-Δt⁄τ , where t is the time since the last request was issued , which represents an exponential decay. In practice, instead of multiplying all total costs by the exponential decay, we can multiply just the cost of the newly incoming request by et⁄τ and normalize eventually.
The cost of a new request is then redefined as:
c = e(t/τ)c0 = e(t/τ)(w⁄s).
That per-request cost is then added to the priority class’s total cost. When the number of concurrent requests dispatched to the fair queue is lower than its capacity (in this context, the I/O Queue’s local I/O depth), every request can go in. But when there is contention, some requests will have to be queued and the fair queue will pick the next request among the queued ones from the priority class with the lowest total cost so far.
This exponential decay cost-based algorithm guarantees that when a class has no competition it can have the available bandwidth all to itself. In the face of competition, the queue can react quickly to changes in the submission rate of the different priority classes, and at the same time smoothly keep a history of submissions in the recent past for the purposes of balancing. All classes should have their shares proportion respected and no class should starve, as I/O Queue will keep balancing requests as they arrive.
ScyllaDB’s I/O Scheduler in practice
We will now run a couple of examples that demonstrate ScyllaDB/Seastar’s I/O Scheduler and its results balancing different priority classes. In the first example, let’s go back to the example application fair_queue_tester that we have used in “Choosing the right number of I/O Queues” to show the effect of the I/O Queue balancing in isolation. This time, we’ll bump up the request size to a more realistic 128KB, and run in a single shard—with obviously a single I/O Queue—keeping the remainder of the setup unchanged.
Table 3 shows the results of a 60 second run with a 4-class system (C1, C2, C4, C4), varying each share’s proportions for each run. The first thing to notice is that with 128KB request sizes, Seastar is easily able to saturate the SSD with a single core.
Looking at the resulting throughput figures, we can see that the balancing goes according to theory and obeys the desired shares distribution well, with minor differences seen only in the last digits. Those are expected because in this time-based test, we may end the test in a moment where the queue is momentarily imbalanced.
Also, we can see that the absolute value of shares doesn’t really matter. The ratio between them is what really matters, and in the two first rows where all shares are equal, the resulting throughput is also equal, about the same for the values 10 and 100.
| Shares distribution | Throughput (KB/s) | |||
| C1 | C2 | C3 | C4 | |
| 10, 10, 10, 10 | 137506 | 137501 | 137501 | 137501 |
| 100, 100, 100, 100 | 137504 | 137499 | 137499 | 137499 |
| 10, 20, 40, 80 | 37333 | 73732 | 146566 | 292375 |
| 100, 10, 10, 10 | 421211 | 42922 | 42922 | 42922 |
Table 3: 4 classes disputing the same I/O Queue, with various shares distributions
Putting it all together
In real-life execution of a complex system like ScyllaDB, all sorts of things are happening at given moment and the node is doing other things aside from constantly pushing I/O. Still, we should be able to see the I/O Scheduler working in practice to guarantee good behavior in those cases. To demonstrate that, we will run a single i2.8xlarge instance on Amazon EC2. By running a single node, we can focus on the local disk I/O results and isolate all other cluster issues, and an i2.8xlarge is a good enough machine that every shard can have its own I/O Queue.
To create data for the population of this test , a cassandra-stress load will run, writing 600M unique partitions with the default size (not shown in the images, partition size is in the hundreds of bytes). We will then shut down ScyllaDB and restart it fresh to make sure that all caches are flushed and subsequent reads are served from disk, and then initiate 5 clients running the following command:
N=600000000
DEV=$(($N/2))
taskset -c 1-7 cassandra-stress mixed \
'ratio(read=1)' duration=25m  -pop "dist=gaussian(1..$N,$DEV,$DEV)" \
-mode native cql3 -node $SERVERS -rate threads=500
This will get all clients to read keys from that range at random, in a gaussian distribution. Because the cache is empty, every read will have to be served from disk, with the exception of the ones already fortuitously fetched by some other client . Figures 3 and 4 show some key metrics of the system during the first 5 minutes of this load.

Figure 3: requests served by the node and the overall state of the I/O scheduler. Pending requests are a simple aggregation over all I/O Queues.
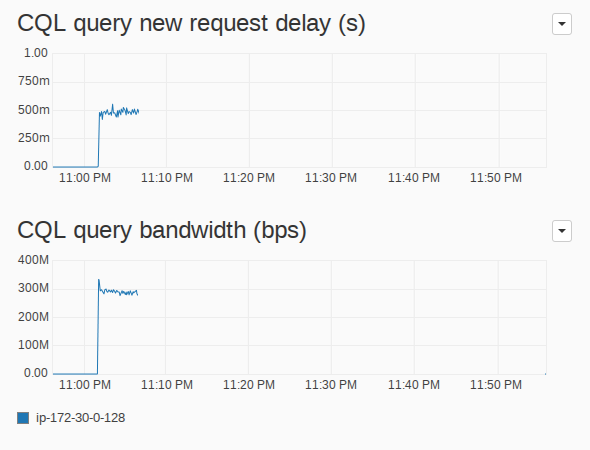
Figure 4: Metrics for the CQL query reads priority class in the I/O Queue. The new request delay is the maximum over all I/O Queues and the bandwidth is a simple aggregation over all I/O Queues.
What we can see in these figures is that at around 300 MB/s, the disk is saturated. This is expected due to the small size of the requests being served. There is a total of a bit less than 2.5K requests sitting in the I/O Queues, and at this point all of them are coming from the CQL query reads class. A new CQL read request arriving at this point will wait for about 500ms in the queue before being sent to the Linux I/O subsystem. At this point, all the I/O Queues are doing is preventing the requests from flooding the disk, as we have discussed in the first part of this article.
But what will happen if a write-heavy workload suddenly starts? To show that, 5 other clients are started after the initial 5 minutes, with the following command line:
taskset -c 1-7 cassandra-stress write duration=20m \
-pop 'seq=600000001..600100000' \
-mode native cql3 -node $SERVERS -rate threads=500
This will run a rewrite workload, writing 100K default-sized partitions in a loop, in a very similar fashion to the the workload used to populate the database. However, we set the -pop parameter so that all writes fall outside the initial population. This guarantees that the writes do not have the side effect of making any entry hot for the readers.
Figure 5 show the evolution of the I/O Queue metrics from its previous state. We can see that in the face of competition for the I/O Queues shares, requests in the CQL query reads priority class have to wait longer for their turn (somewhere between 750 ms and a second), while its bandwidth is reduced to roughly half, at 150 MB/s.
For simplicity, we will focus our write-side analysis in the commitlog priority class, since it is responsible for most of the write bandwidth in this rewriting workload, and omit the others. The commitlog buffer writes are usually much bigger, typically 128 KB in size, but we can see in the bandwidth graph (right side of the figure), that despite the radical difference in request size, the sublinear cost function described in “Internal Functioning of an I/O Queue” works, and the I/O Scheduler balances them well according to the desired shares proportions.
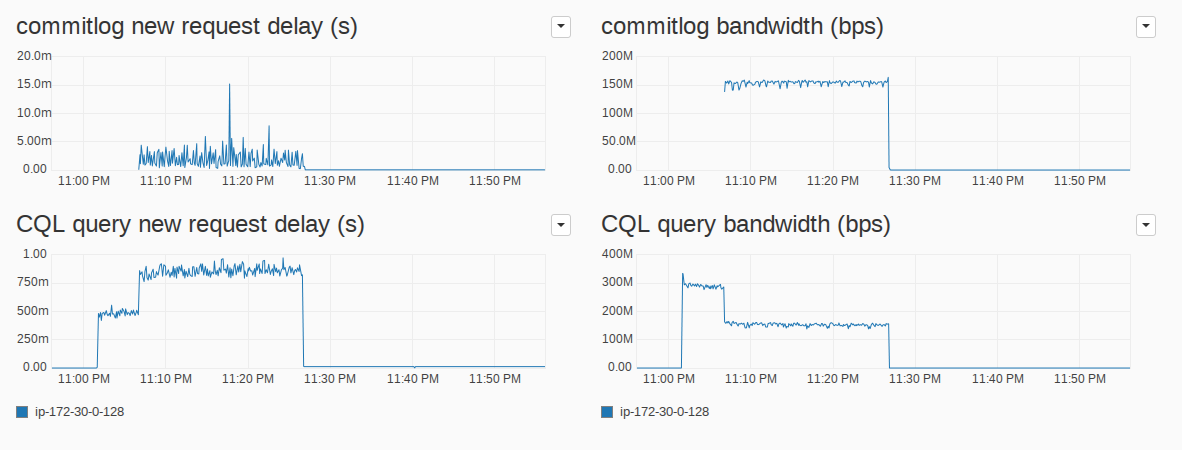
Figure 5: Metrics for the CQL query reads and commitlog priority classes in the I/O Queue. The new request delay is the maximum over all I/O Queues and the bandwidth is a simple aggregation over all I/O Queues.
The increased latency in requests from the CQL query reads priority class is a direct and expected result of the fact that the CQL query reads priority class now has fewer shares for itself, while the initial massive number of read requests, due to their small size is kept unchanged. The reads now just have to wait more to make room for the other priority classes. But we can see that the increase is kept within that priority class and does not influence the commitlog latencies. Those are kept as low as possible, usually at a only a couple of milliseconds.
As we have discussed, this workload was designed not to be heavy on memtables and compaction bandwidth. Because memtable writes and compaction are not constantly called upon, they have a bursty, spiky behavior. Still, it is interesting to look at their request delay graph to see how they behave when they are needed. We can see in Figure 6 that the new request delay for those classes is also fairly small, and totally oblivious to the heavy disk usage induced by the read workload.
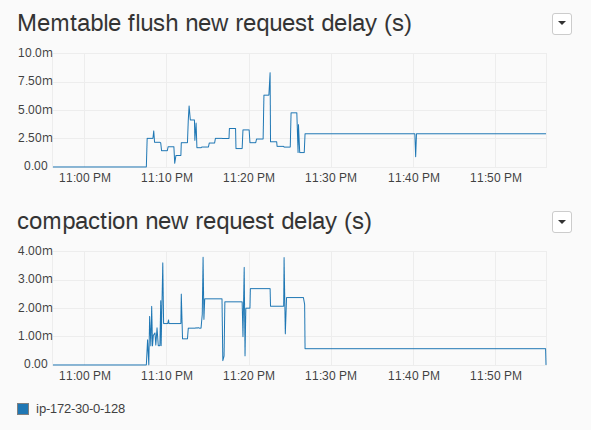
Figure 6: new request delay for the memtable writes and compaction priority classes in the I/O Queues. The new request delay is the maximum over all I/O Queues.
Summary and future work
In this article, we have explored the inner workings of the ScyllaDB I/O Scheduler and how it is used to balance out requests from different priority classes. We have seen examples of the I/O Scheduler in practice, including an example of how it can be used successfully to isolate a write workload running on a node that was previously already saturated with disk reads. Once one understands the mechanics behind that, it should be easy to see how ScyllaDB would, when faced with the inverse situation of a disk saturated by writes, be able to serve reads from disk while keeping latencies low. I/O Queues are also used in a ScyllaDB cluster to make sure that read repairs do not get too big of a share of the disk bandwidth, even if a lot of data needs to be read and/or transferred.
In the current version, the shares for each priority class are statically defined, so that they will balance out equally if they are issuing the same amount of requests. However, there are cases in which giving one of the priority classes the ability to fetch a larger proportion of the total shares would benefit the workload as a whole. For those, future versions of ScyllaDB may dynamically adjust the shares to achieve maximum performance.
Also, there might be cases in which different disk arrays are used, even if this is not needed from a fairness point of view. For example, a future version of ScyllaDB could support a separate volume for the commitlog, which is frequently written, so that the SSD used for the commitlog can be replaced more often than the less frequently written memtable volume. Seastar, and by consequence ScyllaDB, currently only has a single I/O Scheduler per system, but if more than one disk array is used each will have to have its own scheduler. At this moment, this is still not supported by Seastar.
We have shown in this two-part article that by moving the disk I/O scheduler, traditionally associated with the kernel, into userspace, as part of a thread-per-core shared-nothing design, we can achieve more stable and faster results. That’s a powerful strategy to employ in the quest for scalable performance even as the number of cores we must deal with continues to grow.
More information
The first part of this article is Designing a Userspace Disk I/O Scheduler for Modern Datastores: the ScyllaDB example (Part 1). The third part of the series shows how the I/O scheduler provides better latencies under any circumstance. More info on ScyllaDB design and performance is available in the Technology section of the ScyllaDB web site. Follow @ScyllaDB on Twitter or subscribe to this site’s RSS feed to keep up with future development.