The ScyllaDB team is pleased to announce the release of ScyllaDB Monitoring Stack 2.1.
ScyllaDB Monitoring is an open source stack for monitoring ScyllaDB Enterprise and ScyllaDB Open Source, based on Prometheus and Grafana. ScyllaDB Monitoring 2.1 stack supports:
- ScyllaDB Open Source versions 2.3, 3.0
- ScyllaDB Enterprise versions 2017.x and 2018.x
- ScyllaDB Manager 1.3
Related Links
- Download ScyllaDB Monitoring 2.1
- ScyllaDB Monitoring Stack Docs
- Upgrade from ScyllaDB Monitoring 2.0 to 2.1
- Upgrade from ScyllaDB Monitoring 1.x to 2.x
New in Monitoring 2.1
- Upgrade Grafana to Grafana 5.4.2 (Upgrade to the latest, stable, Grafana, Prometheus version #324)
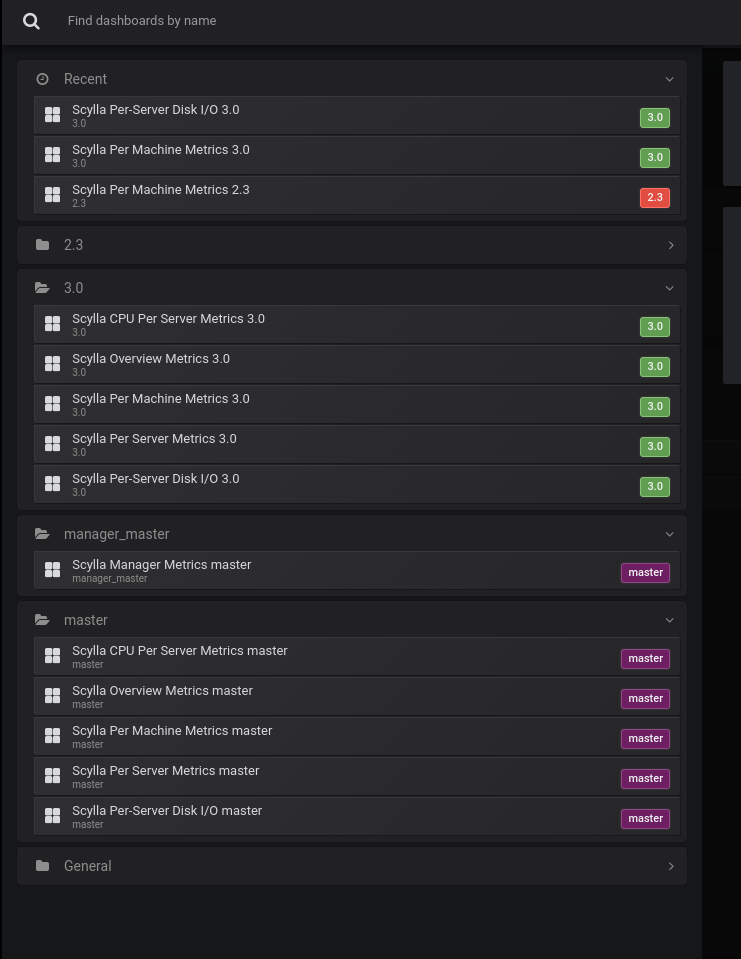
- Grafana made some big changes when moving from version 4 to 5, most of the changes are under the hood. There are some obvious changes like the overall layout and the use for folders for the dashboards. We use folders for versions, so all the dashboards of a specific version will be under the same folder.
Grafana changed the URL path of the dashboards, so if you bookmarked a dashboard (in version 4.x) you will need to update it following the upgrade. - Using local files (Make all plugins local #222, Mount Grafana dashboard directory #48)
From version 2.1 everything is done using local files. Instead of uploading the dashboards with an API, they are placed under grafana/build/{version} and uploaded using a dashboard provisioning file that is placed under grafana/provisioning/dashboards. Plugins are no longer downloaded from the web, they are part of the project located in grafana/plugins. Data-sources are configured from a file that is placed under grafana/provisioning/datasources/. Moving to file configuration and provisioning is safer and faster to upload. - Clickable alerts (Allows jumping from an alert to a dashboard #457) You can now jump directly from an event to the in-depth view. Click the time of the event to set the view time to the event occurrence. Click the server to stay in the same time period.
Customized Dashboard
Notes for users who use their own dashboards.
If you are uploading your files with the API, Grafana 5.x is backward compatible, but some attributes like row height are not supported.
If you are using our templating and the make_dashboard.py script, it will now generate by default, a Grafana 5 format with enhancements.
Rows will be transferred to absolute x, y position (the Grafana 5.x way).
Also, you can use "gridPos" that is used by panels to set the coordination, width, and height to specify dimensions. For example, to set a row size to 2 units heights you can do it like: "gridPos": {“h”: 2}
The make_dashboard script will fill the missing information and make it a valid "gridPos" object.
If you would like to upload your dashboards from a file, note that their format is a bit different than the one the API uses, you only need the part that is inside the "dashboard" tag.
If you are using the make_dashboard.py script, you can use the --as-file flag to generate the files in the right format.