The ScyllaDB team is pleased to announce the release of ScyllaDB Monitoring Stack 4.0.0.
ScyllaDB Monitoring Stack is an open-source stack for monitoring ScyllaDB Enterprise and ScyllaDB Open Source, based on Prometheus and Grafana. ScyllaDB Monitoring Stack 4.0.0 supports:
- ScyllaDB Open Source versions 4.3, 4.4, 4.5, 4.6 and 5.0
- ScyllaDB Enterprise versions 2020.x, 2021.x and 2022.x
- ScyllaDB Manager 2.3.x, 2.4.x, 2.5.x, 2.6.x
This release brings new panels and graphs, bug fixes, stability improvements and performance enhancements.
Related Links
- Download ScyllaDB Monitoring Stack 4.0
- ScyllaDB Monitoring Stack Docs
- Upgrade from ScyllaDB Monitoring 3.x to 4.y
Versions updates for Scylla Monitoring Stack 4.0
- Set Prometheus version to 2.34.0 #1723
- Set Grafana version to 8.5.2 #1723
- Update Loki to 2.5.0 #1723
- Update the Alertmanager version to 0.24.0 #1723
Important Upgrade Notice
To boost performance, ScyllaDB Monitoring Stack 4.0 relies heavily on Recording-Rules. For a minority of users, this would require an extra step past the upgrade.
If after the upgrade some of the latency history is missing like in the following example:
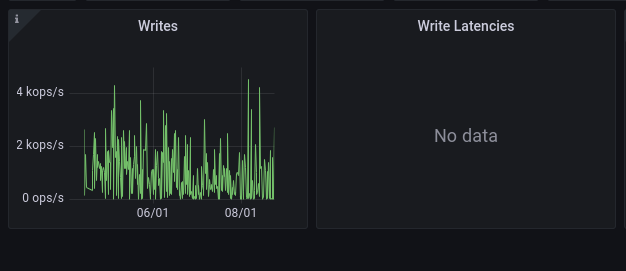
Please refer to the back-filling section in the upgrade guide.
New Information in ScyllaDB Dashboards
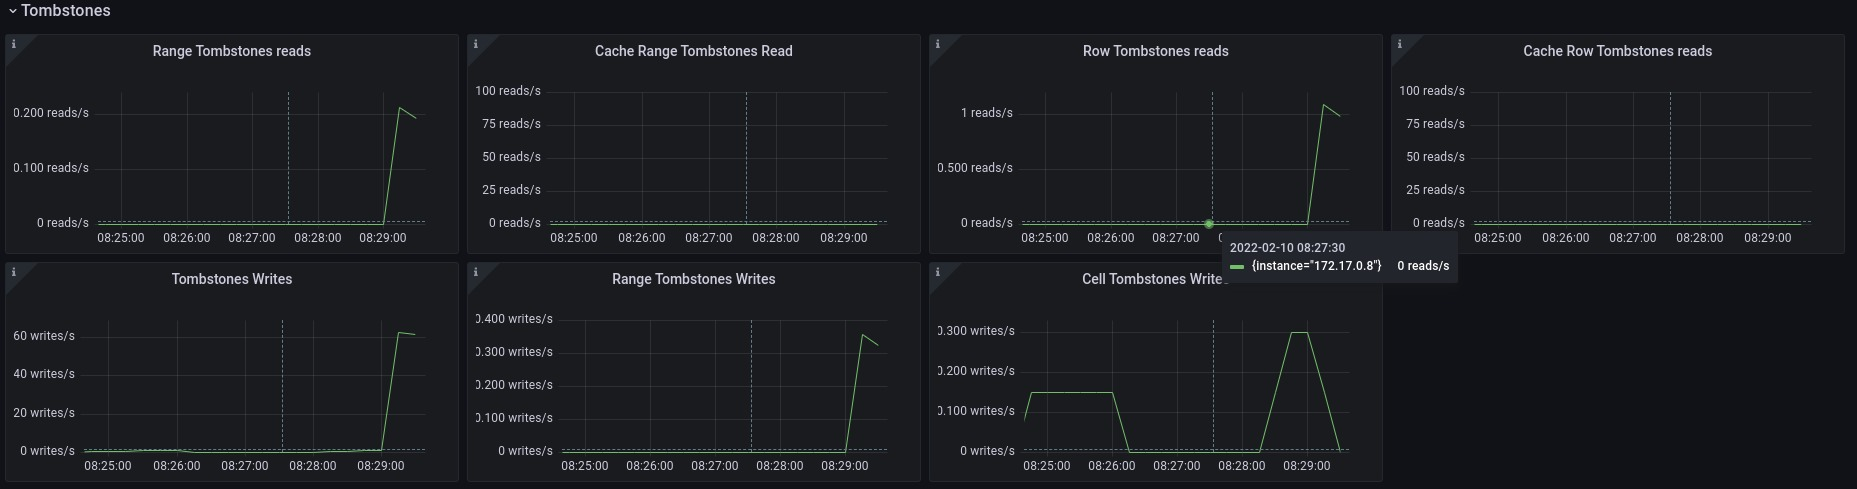
- Add tombstones related panels to the tombstones section in the Detailed dashboard #1644
Bug Fixes
Operational Changes
- Image snapshot should show the entire page #1273
- The default theme is now light, you can override it by adding
-c GF_USERS_DEFAULT_THEME=darkto the start-all.sh command
23 May 2022