The ScyllaDB team is pleased to announce the release of ScyllaDB Monitoring Stack 3.6.
ScyllaDB Monitoring Stack is an open-source stack for monitoring ScyllaDB Enterprise and ScyllaDB Open Source, based on Prometheus and Grafana. ScyllaDB Monitoring Stack 3.6 supports:
- ScyllaDB Open Source versions 4.1, 4.2 and 4.3
- ScyllaDB Enterprise versions 2019.x and 2020.x
- ScyllaDB Manager 2.1.x and 2.2.x
Related Links
- Download ScyllaDB Monitoring 3.6
- ScyllaDB Monitoring Stack Docs
- Upgrade from ScyllaDB Monitoring 3.x to 3.y
New in ScyllaDB Monitoring Stack 3.6
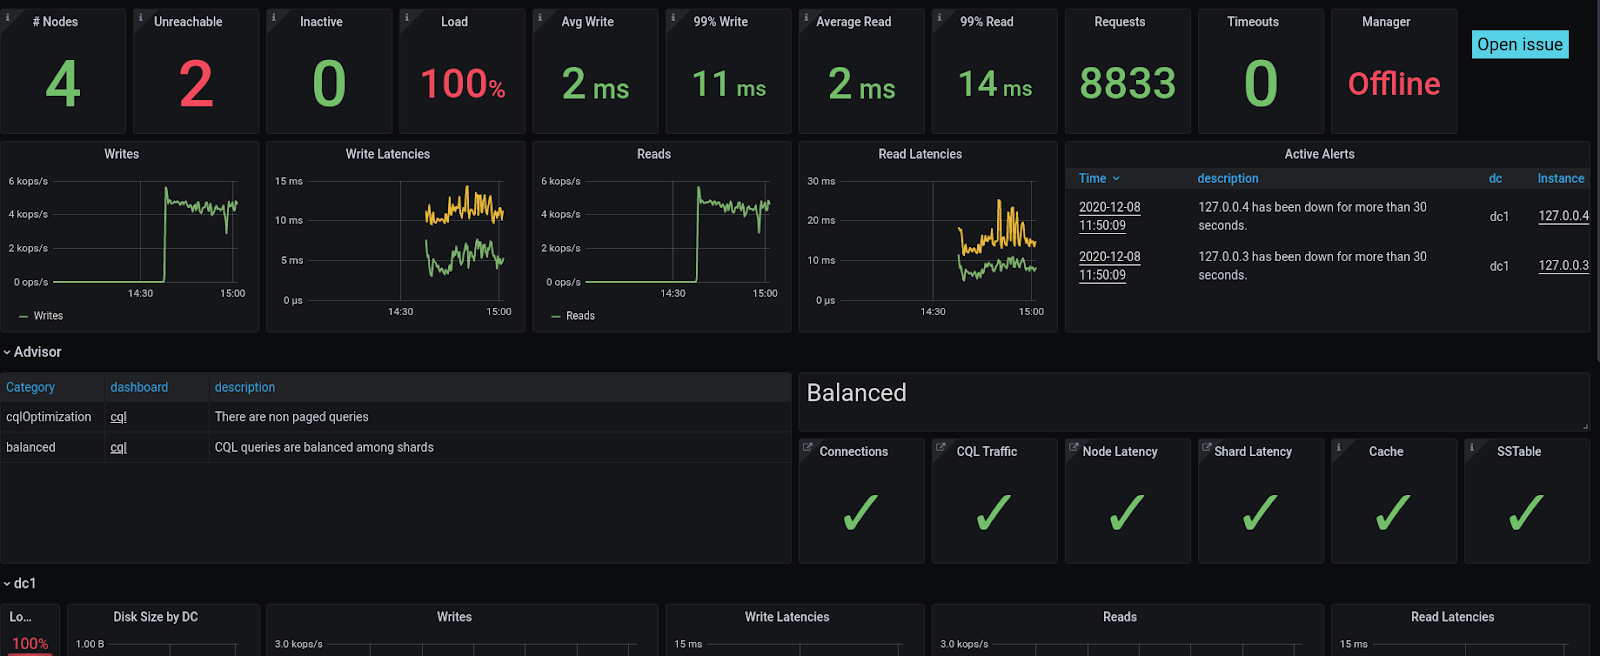
Adding the Advisor section #1162
The Advisor is a new concept in ScyllaDB Monitoring. It identifies potential problems and notifies them. The Advisor section in the Overview dashboard has two parts, one for various issues detected, like unprepared statements. The second is an indication of how balanced the system is. When the cluster works properly, all nodes and shards should act the same. An outlier shard could be a result of a problem. For example, if the number of CQL connections per shard varies between shards, it indicates a driver configuration issue.
Use Loki as data source #1147
Grafana Loki is a log aggregation system inspired by Prometheus. The monitoring stack will use Loki for alert and metrics generation. Note that it does not act as a centralized monitoring system. In ScyllaDB Monitoring, Loki gets the traces using rsyslog. Make sure to configure the rsyslog client on the ScyllaDB servers.
Add ScyllaDB Open Source 4.3 dashboards #1144
ScyllaDB Monitoring Stack now supports ScyllaDB Open Source 4.3.
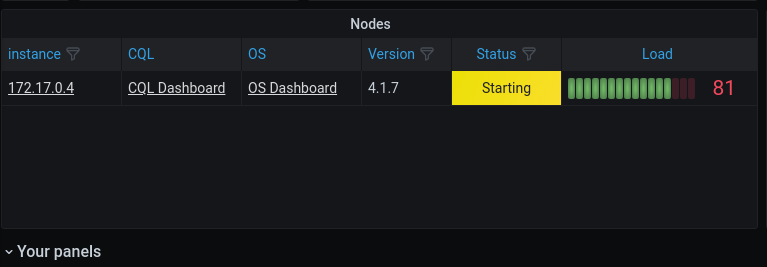
New look to the node table #1097
The node tables are part of the Datacenter section in the Overview dashboard. The table is now more organized and more informative.
This is how it looks like when a node joins the cluster
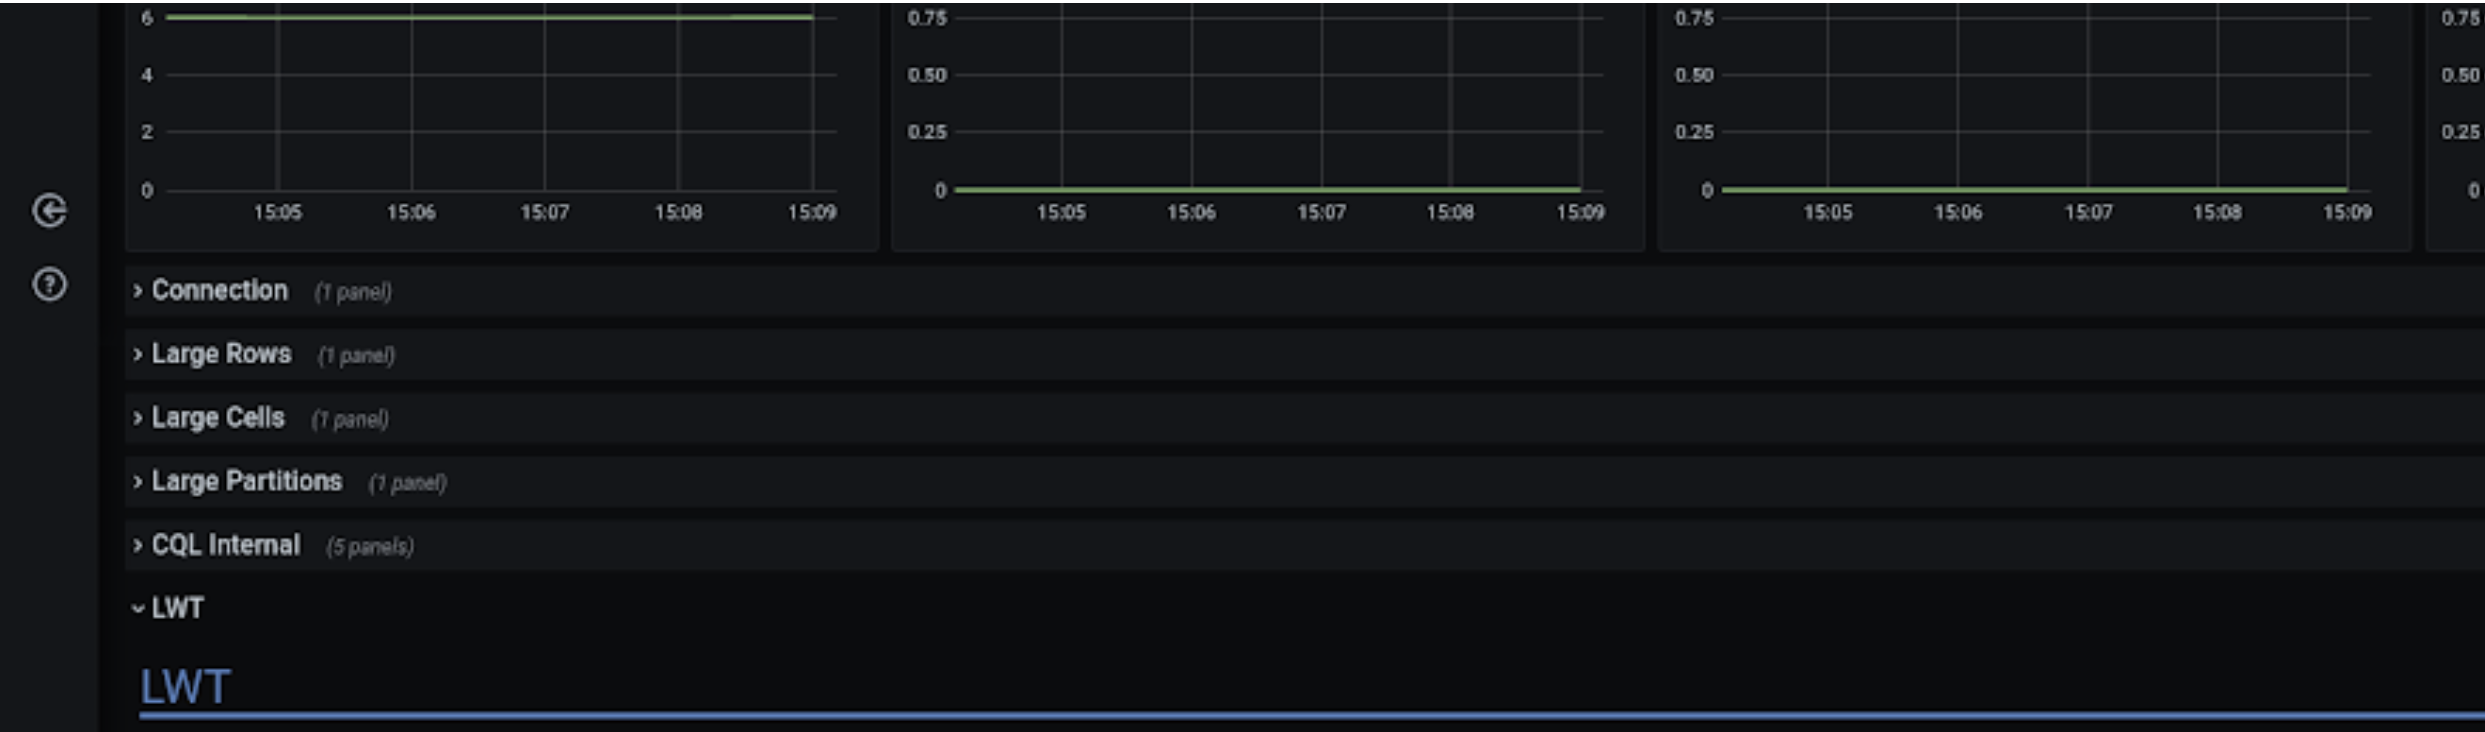
Collapsible rows #973
Collapsible rows are now used in various places on the dashboard. You can open them for additional information.
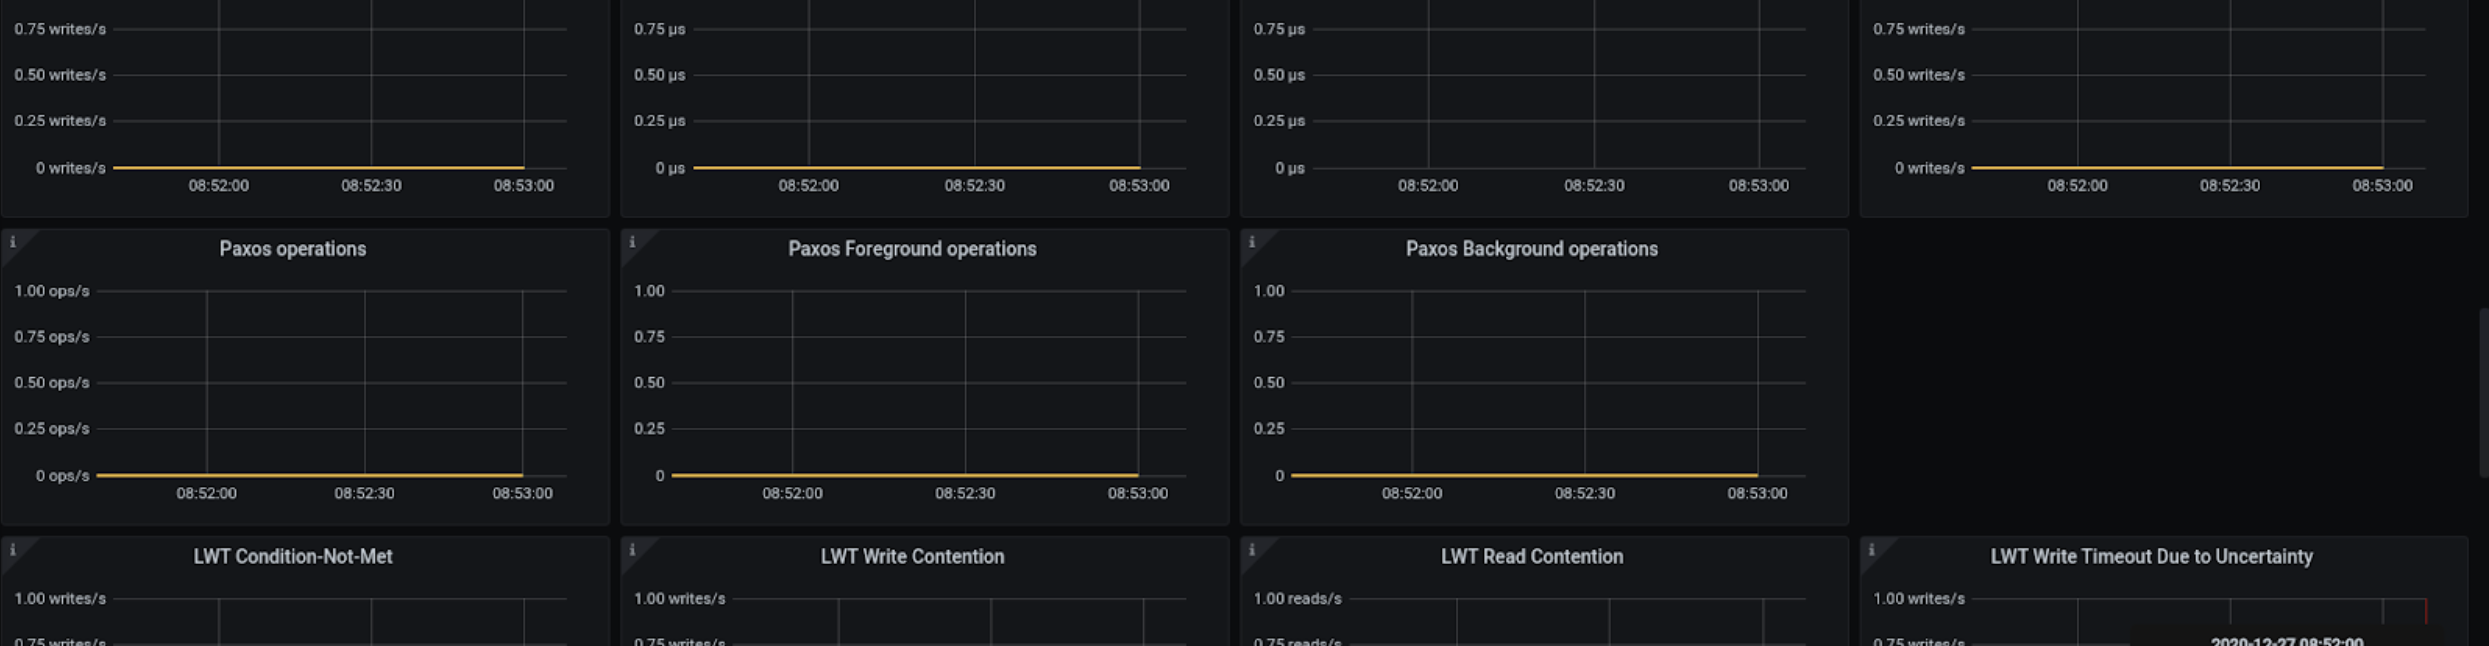
New Lightweight Transactions (LWT) metrics for the dashboard #936
LWT involved multiple Paxos messages. New panels in the LWT section now show the number of Paxos messages. This gives an insight into the actual traffic involved in the LWT operations.
Easy way to capture the entire dashboard, in one click #248
At the bottom of each dashboard, there are now two buttons, one to report an issue on the page and another to take a snapshot of the dashboard as a download image file.
Support dynamic intervals #957
Many graphs on the dashboards use a rate interval; some activity measured over a period of time. There has been a long discussion in the Grafana community as to which interval to use for a timescale.
In general, when looking at graphs of different time ranges (i.e., last hour vs. last week), the time rate interval should make sense.
Grafana 7.2 came with a dynamic interval to solve this issue. You can read more about it here.
Grafana: Use UTC by default #1065
Time shown in graphs is now displayed in UTC time instead of the browser local time.
Upgrade to Grafana 7.3.5 #1061
Operational Changes
- Configure rsyslog on the ScyllaDB hosts. ScyllaDB monitoring uses Loki to generate metrics and alerts from logs. It gets the traces from rsyslog. For the full functionality to work, you need an rsyslog agent running on each of the ScyllaDB machines and to add the scylla monitoring as an rsyslog target.
- Use docker-compose as an optional replacement for start-all.sh #273
- A command line option to add Prometheus targets #1197
Bug Fixes
- Passing
--no-lokigot illegal option:--error#1152
[27 Jan 2021]