The ScyllaDB team is pleased to announce the release of ScyllaDB Monitoring Stack 3.5.
ScyllaDB Monitoring Stack is an open-source stack for monitoring ScyllaDB Enterprise and ScyllaDB Open Source, based on Prometheus and Grafana. ScyllaDB Monitoring Stack 3.5 supports:
- ScyllaDB Open Source versions 4.0, 4.1 and 4.2
- ScyllaDB Enterprise versions 2019.x and 2020.x
- ScyllaDB Manager 2.1.x and 2.2.x
Related Links
- Download ScyllaDB Monitoring 3.5
- ScyllaDB Monitoring Stack Docs
- Upgrade from ScyllaDB Monitoring 3.x to 3.y
New in ScyllaDB Monitoring Stack 3.5
Dashboard reorganization #947
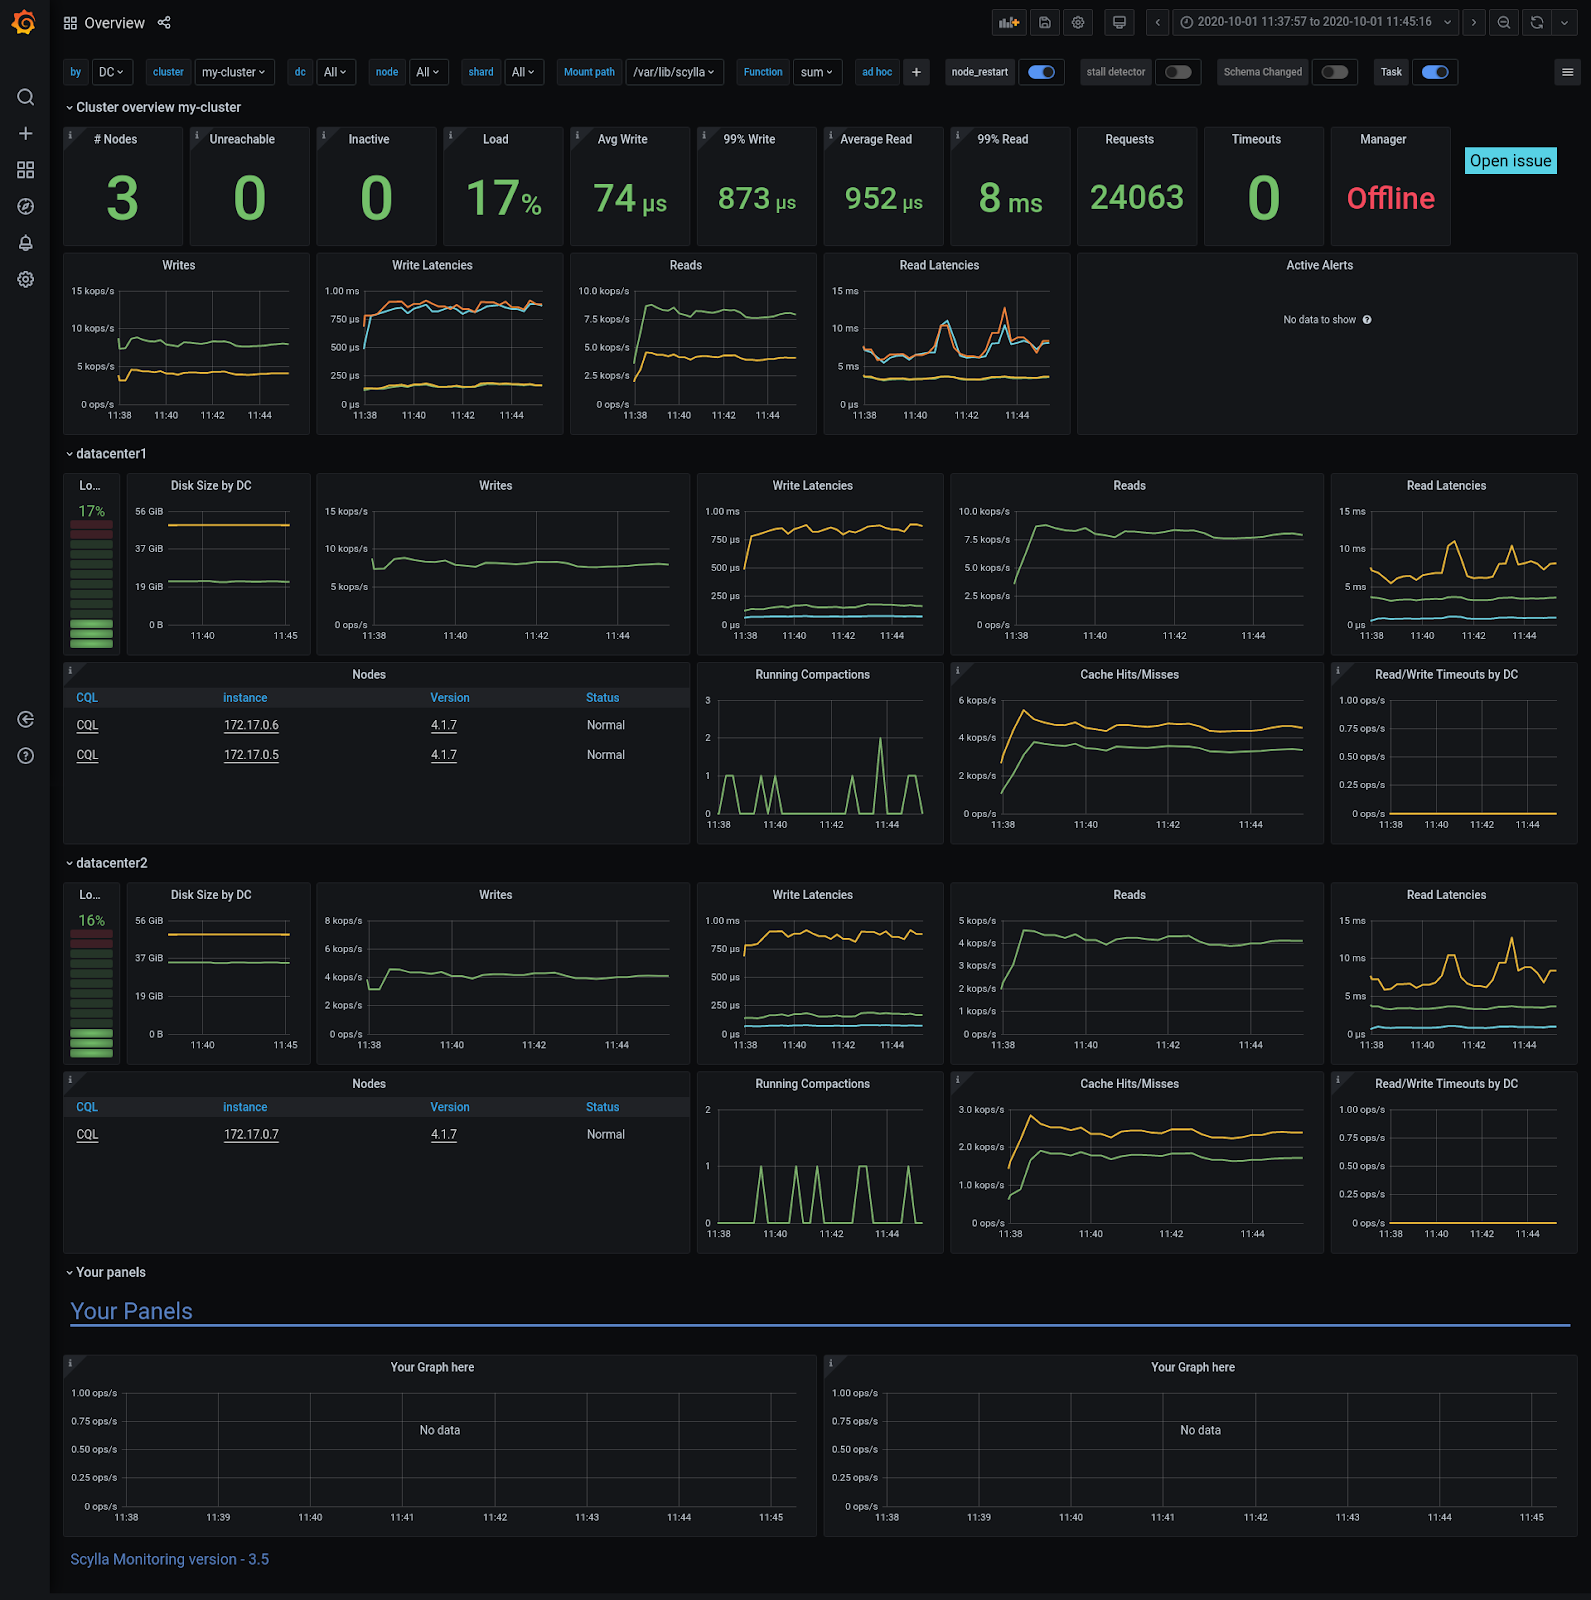
The overview dashboard has a new look. It now gives an overview of the cluster from the data-center perspective.
The reorganization includes a new high-level hierarchy of the dashboard into a Basic and Advance dashboards, where the first should allow users to quickly understand the cluster status, and the second for advanced troubleshooting.
The CPU, Errors, and IO-Queue dashboards, are now under the new Advanced dashboard that is mainly for field engineers and support.
The rest of the dashboards remain the same.
Dashboard folders are now in use only when using more than one version of ScyllaDB at the same time.
New CQL Connection Table
A new table in the CQL dashboard presents a live CQL connection status per node.
To enable this table, and more to follow, you need to configure ScyllaDB as a data source for Grafana. More on how to do that here.
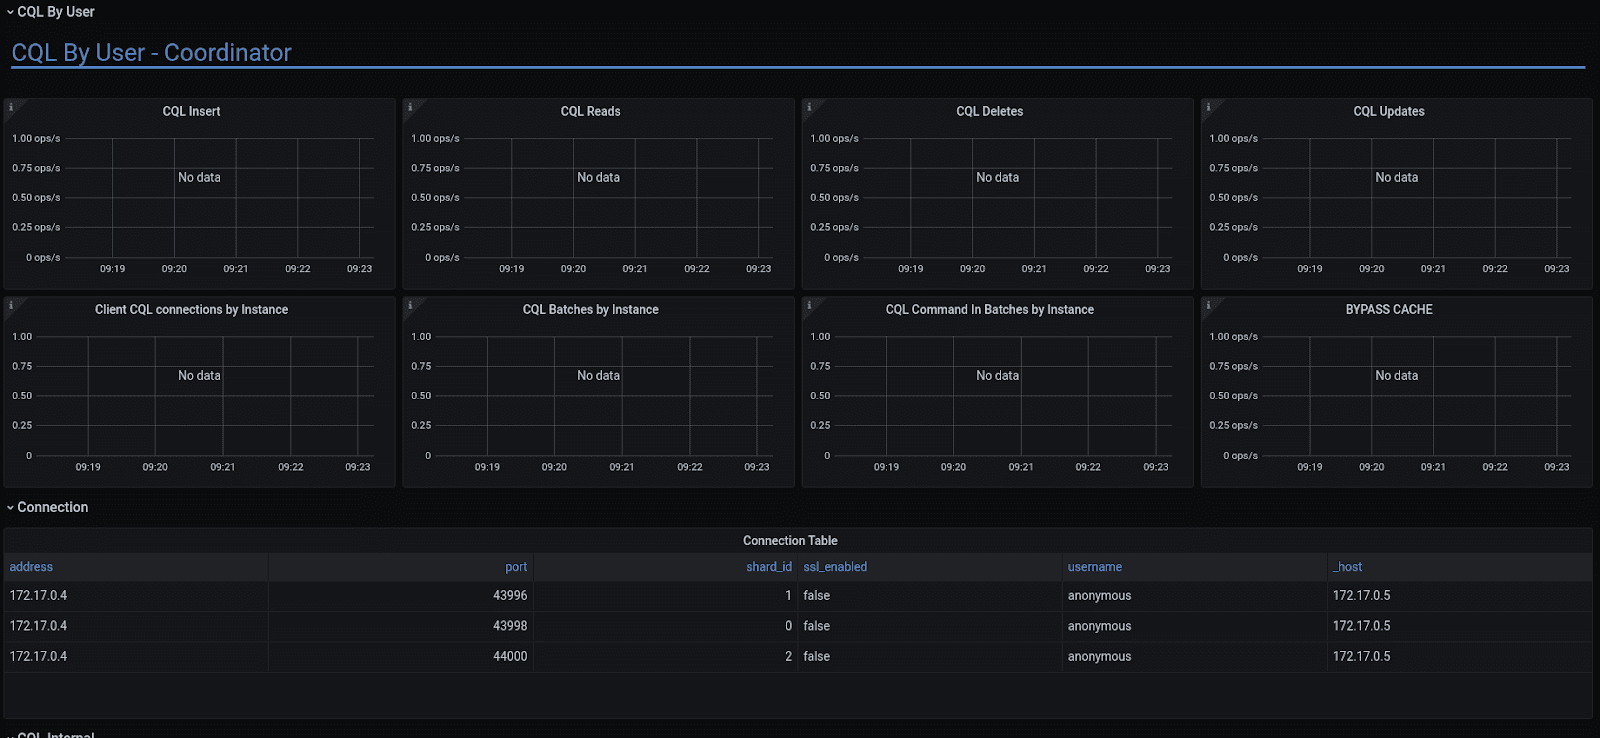
You can use the table to validate the connection per shard per host.
Enable Grafana LDAP Authentication #912
A new flag in start_all.sh enables Grafana LDAP authentication and authorization support. See the documentation for details.
Additional Features
- Upgrade to Grafana 7.1.5 #1030
You can read the related Grafana release notes here. - Add an alert for backup failure. #933
- Add ScyllaDB Manager information to the overview dashboard
Operational Changes
Adding a grafana-image-renderer to scylla-monitoring #904
Grafana’s full-page renderer can be started as an additional container using the -E flag. The image renderer is mostly used with automation.
ScyllaDB Manager 2.2 ports enhancement #1010
ScyllaDB Manager 2.2 changed its listening ports; the new release would try to read from both the old ports and the new for the migration period. For users using their own Prometheus server, you should set the new port in the Prometheus configuration file.
Add ScyllaDB datasource to Grafana
There is a new Grafana data source for ScyllaDB. The data-source will allow reading table information and show it on the dashboard. Currently, it is used to show client connections from the system keyspace. It is recommended to create a new, separate user with its own password and configure the ScyllaDB data-source.
Bug Fixes
- Dashboard multiple, Stat Joining #976
- Switch all irate to rate #958
- ScyllaDB Manager progress panel should be percent #968
- Prometheus version downgrade due to Consul integration issue
29 Oct 2020