The ScyllaDB team is pleased to announce the release of ScyllaDB Monitoring Stack 3.4
ScyllaDB Monitoring Stack is an open-source stack for monitoring ScyllaDB Enterprise and ScyllaDB Open Source, based on Prometheus and Grafana. ScyllaDB Monitoring Stack 3.4 supports:
- ScyllaDB Open Source versions 3.2, 3.3, 4.0 and the upcoming 4.1
- ScyllaDB Enterprise versions 2018.x and 2019.x
- ScyllaDB Manager 2.0.x and 2.1.x
Related Links
- Download ScyllaDB Monitoring 3.4
- ScyllaDB Monitoring Stack Docs
- Upgrade from ScyllaDB Monitoring 3.x to 3.y
New in ScyllaDB Monitoring Stack 3.4
- Dashboards for ScyllaDB Open Source 4.1 #926
- Upgrade to Grafana 6.7.3 from 6.6 #855
- Upgrade to Prometheus 2.18.1 from 2.15.1 #854
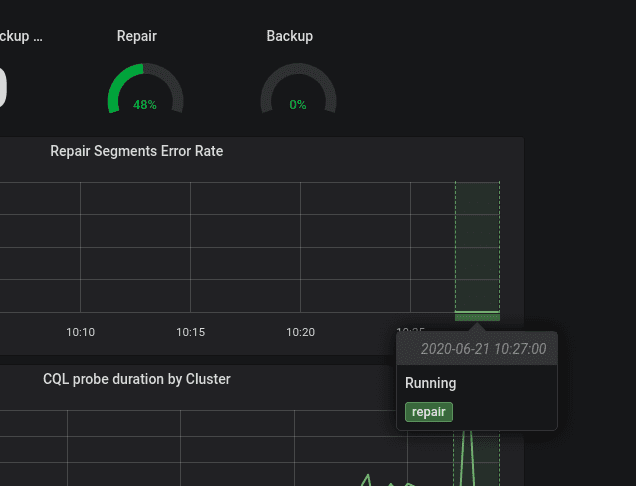
- Support range annotations #852
With the addition of Grafana’s range annotation, the Manager task annotations are now shown as a range.This is how a running repair looks like on the graphs.
- ScyllaDB Manager 2.1 added agent and server system metrics #874
There is a new Manager agent section in the Manager dashboard that monitors the Manager-Agent that runs on each of the nodes.

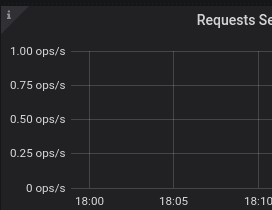
- Set units “ops, rps, wps to ops/s reads/s and writes/s #737
Some of the dashboards units were unclear, for example, ops can mean both operations/seconds or operations. Using Grafana user-defined types, it was changed to more precise types.
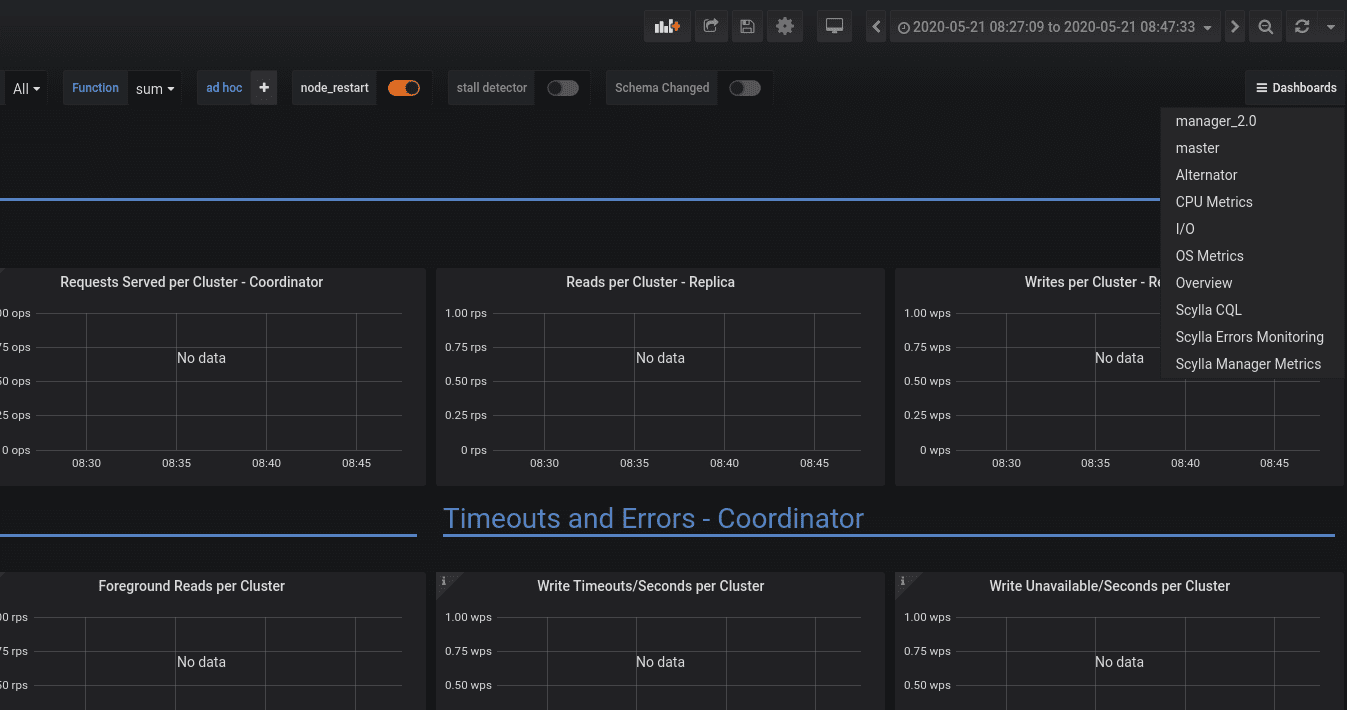
- Add a quick navigation that keeps the time selection #946
The filtering line has now a quick dashboard navigation that keeps the time range and variable selection.
- Scheduling group CPU metrics are now averaged by default #945
In the CPU dashboard, the usage is now averaged by default with an option to choose another aggregation function.
Operational Changes
- Allow saving of provisioned dashboards from the UI #802
It is now possible to save changes you made to a dashboard. You should do so with care. If you want to make persistent changes to your dashboard you should use an external directory for Grafana (see ScyllaDB Monitoring documentation). node_exporter scrapis set to 1m #919
node_exporteris an agent that reads the OS related metrics from a node (memory, disk usage and network) reducing its scrap interval, reduces some unneeded load from the nodes and is safer in case of a slow response.- Update the alertmanager plugin to 0.0.8 #917
Add Apache Licence to the project #263
Bug Fixes
- Fix relative path for internal links #952
- Filter out ScyllaDB Manager successful health check annotation #941
17 Jun 2020