The ScyllaDB team is pleased to announce the release of ScyllaDB Monitoring Stack 3.2.
ScyllaDB Monitoring Stack is an open-source stack for monitoring ScyllaDB Enterprise and ScyllaDB Open Source, based on Prometheus and Grafana. ScyllaDB Monitoring Stack 3.2 supports:
- ScyllaDB Open Source versions 3.1, 3.2 and the upcoming 3.3
- ScyllaDB Enterprise versions 2018.x and 2019.x
- ScyllaDB Manager 1.4.x and ScyllaDB Manager 2.0.x
Related Links
- Download ScyllaDB Monitoring 3.2
- ScyllaDB Monitoring Stack Docs
- Upgrade from ScyllaDB Monitoring 3.x to 3.y
New in ScyllaDB Monitoring Stack 3.2
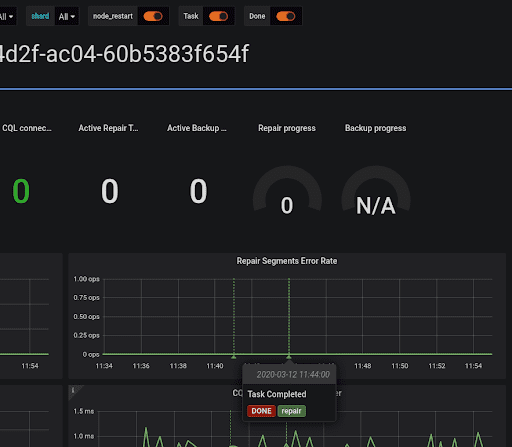
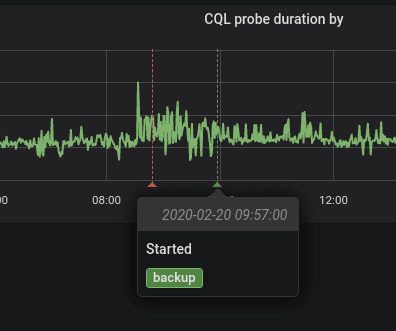
- Add annotation for ScyllaDB Manager tasks – The manager dashboard has now annotations for the beginning and termination of its tasks (repair and backup)
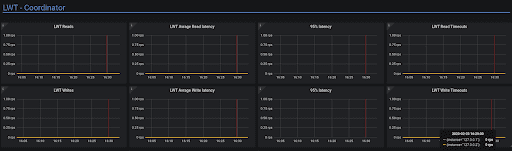
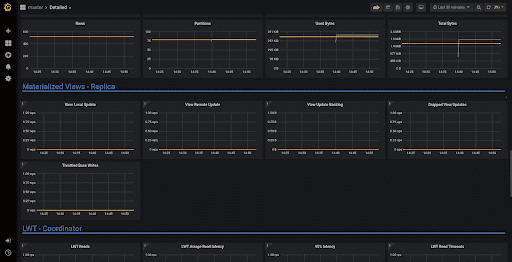
- New Lightweight Transactions (LWT) section to the detail dashboard
LWT is a new experimental feature in ScyllaDB 3.2 and 3.3
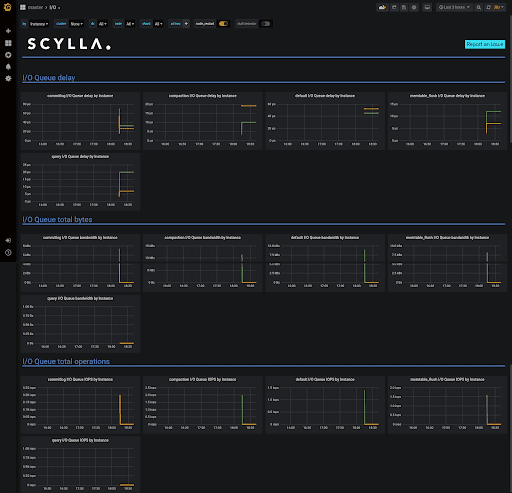
- Show all possible I/O queue classes, the IO dashboard is now split into sections, each containing all possible io queue classes. This will support dynamic classes that are being added to the Enterprise release.
- New ScyllaDB Open Source 3.3 dashboards
- Move to Grafana 6.6. More on Grafana release can be found here
- Move to Prometheus 2.15.1. More on Prometheus release can be found here
- Grafana security – Support specifying the default role. This will allow you to start the monitoring stack with a restricted default role.
For example:start-all.sh -Q Viewerwill start Grafana with the default role set to Viewer.
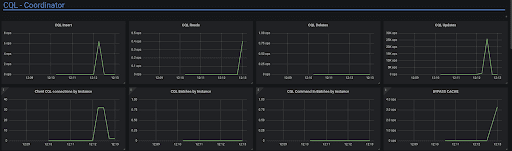
This is useful when your dashboards are open to a public audience, in which you prefer that the users will not be able to make changes to the dashboard. - A new BYPASS CACHE panel in the CQL dashboard, showing the number of queries that uses BYPASS CACHE
- A new Local (Base table) and Remote (Materialized View table) update panels
- New Hinted Handoff panel in the detailed dashboard.
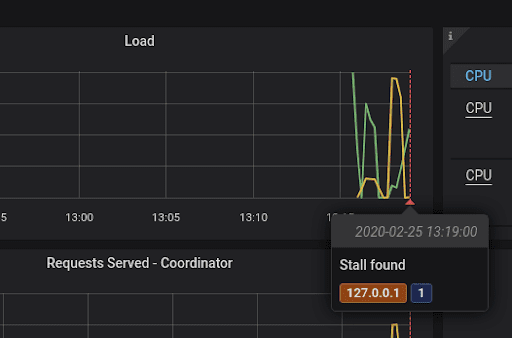
- A new annotation for reactor stalls. ScyllaDB reactors report any stalles larger than a pre set value (command line parameter blocked-reactor-notify-ms, default 100ms)
- A new ignore future metrics to the Error dashboard.
Bug Fixes
- Bring back help strings that removed by mistake #841
- Compaction share graph shows wrong results #817
19 Mar 2020