
As most earthlings are aware by now, two severe attacks under the names of Meltdown and Spectre were currently disclosed and it affects pretty much everybody living in modern society.
Although there is no defense against the more elaborate Spectre, there is a software defense against the more widespread Meltdown. However, there is a catch that set the Internet on fire over the past few days. To protect oneself against Meltdown brings with it a performance penalty of up to 30%.
That happens because Meltdown allows an attacker to read memory that is mapped into a process virtual address space even though the process has no permissions to do it. The brute force solution is then to keep those pages unmapped—making system calls a lot more expensive. That is known in the Linux circles as Kernel Page Tables Isolation or KPTI for short.
Since the increased cost comes from the fact that system calls and context switches become more expensive, software that does more of those two things are supposed to take the heaviest hit. That includes, of course, databases. In practice, particular characteristics of the specific database can make the situation better or worse.
In this article, we will analyze the impact of KPTI in ScyllaDB and show that due to its modern close-to-hardware architecture that bypasses the Operating System for most tasks, ScyllaDB is significantly less affected by the patch to Meltdown than other database software.
ScyllaDB’s Internal Architecture
Although ScyllaDB falls into the general category of “Databases”, it employs a thread-per-core asynchronous architecture, meaning that its internal tasks run pinned to a CPU and there are no thread pools or any other multithreading contentions. Every I/O is issued through batched asynchronous system calls through ScyllaDB’s internal I/O Scheduler, and the Linux page cache is not used at all. Moreover, due to our polling architecture system calls, especially the I/O related ones, are heavily batched and ideally dispatched only at specific intervals called the poll period.
In practice, ScyllaDB has to employ a few helper threads because not all system calls are actually non-blocking and to bypass some scalability issues in the Linux Kernel in enforcing the poll period. Although we have been sponsoring work in the Kernel Community to improve Linux in a way that would reduce that need in the long term, we live in the short term where some context switches will be present.
Still, ScyllaDB is expected to do a lot fewer context switches than a thread-based database. For this analysis, we will use two separate workloads (writes and reads) with very small partitions (around 100 bytes), which should generate an adversarial number of context switches, interrupts, and system calls, leading to the worst case scenario for KPTI.
All the following experiments were done using AWS’s i3.16xlarge VMs using ephemeral NVMe for the data partition and ScyllaDB’s 2.0.2 official AMI.
Writes
We can use the perf tool on a single CPU to gain some insight on the context switch situation. During a 100% write workload where ScyllaDB is ingesting around 1 Million entries per second, we can see the following:
As we can see in the output above, during the 100 seconds for which we ran perf on CPU1, which is fully utilized by ScyllaDB, we executed around only 4k context switches per second.
Even more refreshing is the fact that there are only 422 page-faults during that time. This comes from the fact that we bypass the Linux Page cache entirely and manage our own memory in userspace.
We can also gather a system call profile for a specific CPU, taking advantage of the fact that one ScyllaDB thread will be pinned on that CPU:
In total, there were around 6k/s system calls for a total of around 10k/s “OS events” (system calls/context switches).
There is heavy activity in the networking side of things and from our pollers, but since ScyllaDB acks requests from memory and writes memtables and compacts in the background, there isn’t really a lot of I/O syscall activity (io_submit and io_getevents). We do note, however, that up to 128 requests can be sent with a single call to io_submit, this doesn’t mean the disk is underutilized—only that it has an access pattern that is prone to batching due to the requests being out of the foreground latency path.
Reads
Let’s now look at a 100% reads with a 100% cache-miss workload (achieved by disabling the cache entirely) where despite the small size of the partitions, ScyllaDB is driving 2GB/s of read bandwidth from the disks. That means a pattern with many small reads where we can’t really amortize the cost of the interrupts over the size of the read. This should bring us closer to the worst case scenario for reads.
On the context switch front, the situation is slightly better but not fundamentally different, which matches our expectations: the vast majority of the context switches comes from our current polling mechanism and some of them will come from the execution of blocking system calls like fsync, which are less present in read-only workloads
And after that, we can also look at the system call profile:
As we can see, the profile changes a bit with the I/O system calls having more prominence, yet still not in excessive numbers. The reason can be partially attributed to the batching work that we do before dispatching which greatly reduces the amount of I/O syscalls that ScyllaDB needs to issue.
Compared to the write workload, we can see that the total number of events (context switches + system calls) is about the same. So for simplicity, we will focus on writes for the following evaluation.
How does it look on the inside?
To finish our theoretical analysis, it is illuminating to look inside the servers during the execution of the benchmark. Looking at a sample of the CPUs, in the interest of brevity, we see the following profile:
As we can see, as a result of ScyllaDB’s architecture, the vast majority of time is spent in userspace. This is not surprising due to the low number of system calls we have seen in our strace profile. Together with the low number of context switches that comes as a result of our thread-per-core architecture, we do not expect to see a lot of impact coming from the Meltdown fixes.
A quick benchmark
From what we could see in the previous session, we don’t expect, in theory, the Kernel Page Tables Isolation patch to impact ScyllaDB in a major way as our rate of calls into the Operating System, context switches, and page faults is very low for database standards.
To put that to a test, we execute again the simple benchmark we have used to capture the perf characteristics in the previous session.
In details, the server is a single-node i3.16xlarge node in an empty database with 8 loaders executing the following command:
In other words, 8 clients connect to the database and write constantly from a possible set of 1 Billion partitions for 20 minutes. The tests were done using the patched 4.14.12-1.el7.elrepo.x86_64 kernel from the CentOS EPEL repository.
After the end of the 20 minute period, ScyllaDB had processed 1,278,012,522 requests—an average rate of 1.06M/s writes. We have then restarted the kernel using the nopti boot option which effectively disables the patch. We carefully confirmed that the patch is indeed disabled:
Running the same workload, ScyllaDB now processes 1,361,158,213 requests over the same 20 minutes—an average rate of 1.13M/s writes. Fixing Meltdown has the side effect of making ScyllaDB 6% slower—a far cry from the 30% upper bound seen for complex server software, and much closer to the 5% lower bound usually published.
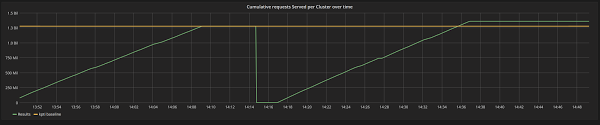
Figure 1: First run (left) is the kernel baseline that executes 1,278,012,522 requests (yellow threshold line). To the right, KPTI=off in the kernel command line. Results are 6% better.
A Cluster benchmark
Although the results we obtained for a single node helped us reason about what is going on under the hood, ScyllaDB, as most modern NoSQL databases, is a complex clustered software that is designed to replicate data over many nodes. Reason tells us that on the one hand, running a cluster will incur more network traffic. But on the other hand, our batching asynchronous implementation should mitigate it.
To know for sure, we’ll now run ScyllaDB as a cluster of 3 x i3.16xlarge instances with a replication factor of 3, and make the workload a bit more demanding on the disk by increasing the number of columns and total population to 8 Billion records (each loader will now write a disjoint 1 Billion range), with the following command:
The difference, in this case, is less than 2%, with the baseline kernel executing 940,522,823 requests— the average rate of 522k/s writes. After rebooting the three machines and confirming that KPTI is indeed disabled, as seen below:
We wiped out the drives and see the same load execute 953,723,243 requests—a marginally better result than the baseline. It is interesting to note that this workload is quite tolling in the server resources: as we can see in Figures 3, 4, and 5, the CPUs are all being used at 100% and the disk is doing over 1GB/s at its peaks.

Figure 2: The baseline kernel executes 940,522,823 requests while disabling KPTI bring us to 953,723,243. An improvement of around 2%.

Figure 3: During the execution of both benchmarks, the average usage of all CPUs in all servers is 100% for most of the execution. The image above is the execution of the pti=off variant.

Figure 4: Between compactions, memtable flushes and compactions, the disks peak at more than 1 GB/s for this workload (reads and writes). The image above is the execution of the pti=off variant.

Figure 5: Network bandwidth (Rx and Tx) is over 5GBps at peaks. The image above is the execution of the pti=off variant.
Conclusion
Last week, the entire industry was set ablaze by the disclosure of the Meltdown and Spectre vulnerabilities. Software fixes for the Operating System are available but they make every interaction with the Operating System more expensive.
While nobody will escape unscathed from this fact—including ScyllaDB—we have demonstrated that the impact on ScyllaDB is relatively low, especially for a database software. Although at first surprising, these results are easily understood when we note that ScyllaDB spends over 90% of its time in userspace. Disk I/O is handled by ScyllaDB’s userspace I/O Scheduler and sent through asynchronous I/O APIs to the Operating System batched at fixed intervals. Context switches are few as a result of the thread-per-core execution.
Although different workloads will always trigger different execution profiles and as a consequence different results, we went to great lengths to explain how the results we showed are intimately connected to our architecture. As such, we expect results to be good across a great variety of workloads.