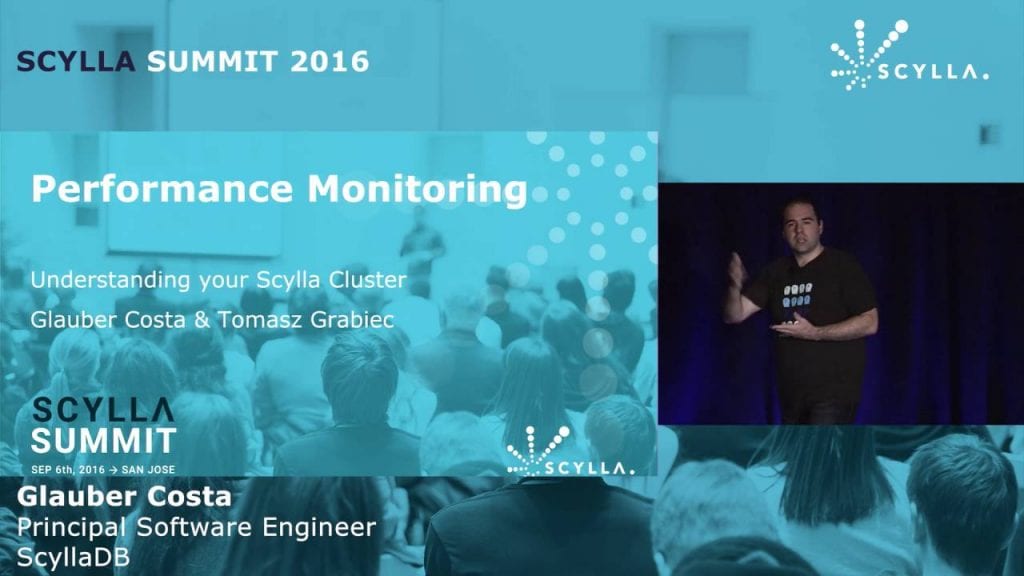
Last month we gave a talk at ScyllaDB Summit that described the caveats and best practices for monitoring a live ScyllaDB cluster. Once the cluster is ready to serve your requests, you will need to monitor it to understand its performance characteristics, its overall health, and should anything go wrong, understand what was it was that upset the cluster’s behavior.
ScyllaDB Summit 2016: Monitoring Deep Dive: The best tools for the job and the metrics exported by ScyllaDB
from
ScyllaDB Summit 2016
ScyllaDB is a regular Linux process, so as a first instinct many people will fire standard Linux tools commonly used for performance monitoring and analysis. While that is a fine practice, some of the programming techniques we use may cause such tools’ output to be misleading.
One example is the ubiquitous ‘top’. In our quest to reduce user visible latencies, ScyllaDB busy-loops its main event loop for a period of time even if the system is idle. Should a request arrive at that very time, we handle it without incurring wake up and context switch latencies, but as a result, even if the load in the system is extremely low, one may still see high CPU usage as reported by top.
To address this issue of internal system visibility, ScyllaDB exports its internal metrics for consumption by so external tools, such as collectd. ScyllaDB integrates well with any existing collectd solution you may already be running. For those not yet deploying a collectd-based monitoring solution, ScyllaDB ships with its own starter alternatives such as scyllatop, which provides a top-like ad-hoc interface that can be used to quickly and directly check for metrics. Also, we provide docker images for a Prometheus+grafana solution already pre-loaded with many interesting dashboards highlighting aspects of the system we believe are important to track (but not the only ones that are important to track!). Instructions on how to set up monitoring are available here
Knowing which metrics ScyllaDB exports and what they track is key for analyzing the performance of a ScyllaDB cluster. Familiarity with the metrics as well as understanding the limitations standard Linux tools have when applied to ScyllaDB will put you in a better position for a successful deployment.
Check out the video and slides of the presentation to get the whole deep dive into monitoring ScyllaDB.


